Capital One 2011 Annual Report Download - page 232
Download and view the complete annual report
Please find page 232 of the 2011 Capital One annual report below. You can navigate through the pages in the report by either clicking on the pages listed below, or by using the keyword search tool below to find specific information within the annual report.-
 1
1 -
2
-
3
-
4
-
5
-
6
-
7
-
8
-
9
-
10
-
11
-
12
-
13
-
14
-
15
-
16
-
17
-
18
-
19
-
20
-
21
-
22
-
23
-
24
-
25
-
26
-
27
-
28
-
29
-
30
-
31
-
32
-
33
-
34
-
35
-
36
-
37
-
38
-
39
-
40
-
41
-
42
-
43
-
44
-
45
-
46
-
47
-
48
-
49
-
50
-
51
-
52
-
53
-
54
-
55
-
56
-
57
-
58
-
59
-
60
-
61
-
62
-
63
-
64
-
65
-
66
-
67
-
68
-
69
-
70
-
71
-
72
-
73
-
74
-
75
-
76
-
77
-
78
-
79
-
80
-
81
-
82
-
83
-
84
-
85
-
86
-
87
-
88
-
89
-
90
-
91
-
92
-
93
-
94
-
95
-
96
-
97
-
98
-
99
-
100
-
101
-
102
-
103
-
104
-
105
-
106
-
107
-
108
-
109
-
110
-
111
-
112
-
113
-
114
-
115
-
116
-
117
-
118
-
119
-
120
-
121
-
122
-
123
-
124
-
125
-
126
-
127
-
128
-
129
-
130
-
131
-
132
-
133
-
134
-
135
-
136
-
137
-
138
-
139
-
140
-
141
-
142
-
143
-
144
-
145
-
146
-
147
-
148
-
149
-
150
-
151
-
152
-
153
-
154
-
155
-
156
-
157
-
158
-
159
-
160
-
161
-
162
-
163
-
164
-
165
-
166
-
167
-
168
-
169
-
170
-
171
-
172
-
173
-
174
-
175
-
176
-
177
-
178
-
179
-
180
-
181
-
182
-
183
-
184
-
185
-
186
-
187
-
188
-
189
-
190
-
191
-
192
-
193
-
194
-
195
-
196
-
197
-
198
-
199
-
200
-
201
-
202
-
203
-
204
-
205
-
206
-
207
-
208
-
209
-
210
-
211
-
212
-
213
-
214
-
215
-
216
-
217
-
218
-
219
-
220
-
221
-
 222
222 -
 223
223 -
 224
224 -
 225
225 -
 226
226 -
 227
227 -
 228
228 -
 229
229 -
 230
230 -
 231
231 -
 232
232 -
 233
233 -
 234
234 -
 235
235 -
 236
236 -
 237
237 -
 238
238 -
 239
239 -
 240
240 -
 241
241 -
 242
242 -
243
-
244
-
245
-
246
-
247
-
248
-
249
-
250
-
251
-
252
-
253
-
254
-
255
-
256
-
257
-
258
-
259
-
260
-
261
-
262
-
263
-
264
-
265
-
266
-
267
-
268
-
269
-
270
-
271
-
272
-
273
-
274
-
275
-
276
-
277
-
278
-
279
-
280
-
281
-
282
-
283
-
284
-
285
-
286
-
287
-
288
-
289
-
290
-
291
-
292
-
293
-
294
-
295
-
296
-
297
-
298
 |
 |

CAPITAL ONE FINANCIAL CORPORATION
NOTES TO CONSOLIDATED STATEMENTS—(Continued)
Year Ended December 31,
(Dollars and Shares in millions, except per share data) 2011 2010 2009
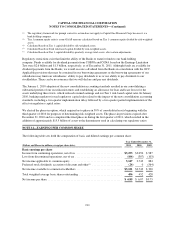
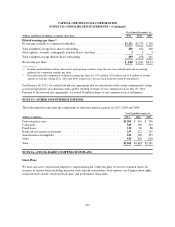
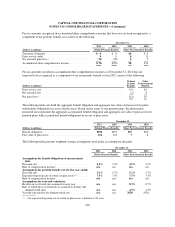
Diluted earnings per share(2)
Net income available to common stockholders ................................ $3,121 $2,743 $ 320
Total weighted-average basic shares outstanding .............................. 456 452 428
Stock options, warrants, contingently issuable shares, and other .................. 343
Total weighted-average diluted shares outstanding ............................. 459 456 431
Net income per share .................................................... $ 6.80 $ 6.01 $0.74
(1) Includes undistributed earnings allocated to participating securities using the two-class method under the accounting
guidance for computing earnings per share.
(2) Excluded from the computation of diluted earnings per share was 29.9 million, 26.8 million and 34.8 million of awards,
options or warrants, during 2011, 2010 and 2009, respectively, because their inclusion would be antidilutive.
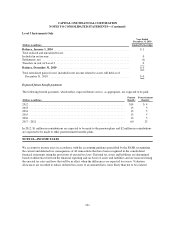
On February 16, 2012, we settled forward sale agreements that we entered into with certain counterparties acting
as forward purchasers in connection with a public offering of shares of our common stock on July 19, 2011.
Pursuant to the forward sale agreements, we issued 40 million shares of our common stock at settlement.
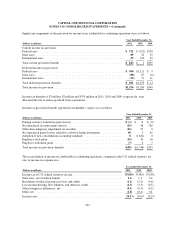
NOTE 15—OTHER NON-INTEREST EXPENSE
The following table represents the components of other non-interest expense for 2011, 2010 and 2009:
Year Ended December 31,
(Dollars in millions) 2011 2010 2009
Professional services ................................................... $1,201 $ 916 $ 796
Collections ........................................................... 549 596 599
Fraud losses .......................................................... 122 80 86
Bankcard association assessments ......................................... 253 221 215
Amortization of intangibles .............................................. 222 220 235
Other ................................................................ 915 650 610
Total ................................................................ $3,262 $2,683 $2,541
NOTE 16—STOCK-BASED COMPENSATION PLANS
Stock Plans
We have one active stock-based employee compensation plan. Under the plan, we reserve common shares for
issuance in various forms including incentive stock options, nonstatutory stock options, stock appreciation rights,
restricted stock awards, restricted stock units, and performance share units.
212