Capital One 2011 Annual Report Download - page 254
Download and view the complete annual report
Please find page 254 of the 2011 Capital One annual report below. You can navigate through the pages in the report by either clicking on the pages listed below, or by using the keyword search tool below to find specific information within the annual report.-
 1
1 -
2
-
3
-
4
-
5
-
6
-
7
-
8
-
9
-
10
-
11
-
12
-
13
-
14
-
15
-
16
-
17
-
18
-
19
-
20
-
21
-
22
-
23
-
24
-
25
-
26
-
27
-
28
-
29
-
30
-
31
-
32
-
33
-
34
-
35
-
36
-
37
-
38
-
39
-
40
-
41
-
42
-
43
-
44
-
45
-
46
-
47
-
48
-
49
-
50
-
51
-
52
-
53
-
54
-
55
-
56
-
57
-
58
-
59
-
60
-
61
-
62
-
63
-
64
-
65
-
66
-
67
-
68
-
69
-
70
-
71
-
72
-
73
-
74
-
75
-
76
-
77
-
78
-
79
-
80
-
81
-
82
-
83
-
84
-
85
-
86
-
87
-
88
-
89
-
90
-
91
-
92
-
93
-
94
-
95
-
96
-
97
-
98
-
99
-
100
-
101
-
102
-
103
-
104
-
105
-
106
-
107
-
108
-
109
-
110
-
111
-
112
-
113
-
114
-
115
-
116
-
117
-
118
-
119
-
120
-
121
-
122
-
123
-
124
-
125
-
126
-
127
-
128
-
129
-
130
-
131
-
132
-
133
-
134
-
135
-
136
-
137
-
138
-
139
-
140
-
141
-
142
-
143
-
144
-
145
-
146
-
147
-
148
-
149
-
150
-
151
-
152
-
153
-
154
-
155
-
156
-
157
-
158
-
159
-
160
-
161
-
162
-
163
-
164
-
165
-
166
-
167
-
168
-
169
-
170
-
171
-
172
-
173
-
174
-
175
-
176
-
177
-
178
-
179
-
180
-
181
-
182
-
183
-
184
-
185
-
186
-
187
-
188
-
189
-
190
-
191
-
192
-
193
-
194
-
195
-
196
-
197
-
198
-
199
-
200
-
201
-
202
-
203
-
204
-
205
-
206
-
207
-
208
-
209
-
210
-
211
-
212
-
213
-
214
-
215
-
216
-
217
-
218
-
219
-
220
-
221
-
222
-
223
-
224
-
225
-
226
-
227
-
228
-
229
-
230
-
231
-
232
-
233
-
234
-
235
-
236
-
237
-
238
-
239
-
240
-
241
-
242
-
243
-
 244
244 -
 245
245 -
 246
246 -
 247
247 -
 248
248 -
 249
249 -
 250
250 -
 251
251 -
 252
252 -
 253
253 -
 254
254 -
 255
255 -
 256
256 -
 257
257 -
 258
258 -
 259
259 -
 260
260 -
 261
261 -
 262
262 -
 263
263 -
 264
264 -
265
-
266
-
267
-
268
-
269
-
270
-
271
-
272
-
273
-
274
-
275
-
276
-
277
-
278
-
279
-
280
-
281
-
282
-
283
-
284
-
285
-
286
-
287
-
288
-
289
-
290
-
291
-
292
-
293
-
294
-
295
-
296
-
297
-
298
 |
 |
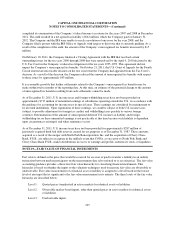
CAPITAL ONE FINANCIAL CORPORATION
NOTES TO CONSOLIDATED STATEMENTS—(Continued)
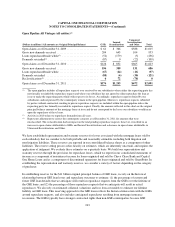
Mortgage Servicing Rights
MSRs do not trade in an active market with readily observable prices. Accordingly, we determine the fair value
of MSRs using a valuation model that calculates the present value of estimated future net servicing income. The
model incorporates assumptions that market participants use in estimating future net servicing income, including
estimates of prepayment spreads, discount rate, cost to service, contractual servicing fee income, ancillary
income and late fees. We record MSRs at fair value on a recurring basis. Fair value measurements of MSRs use
significant unobservable inputs and, accordingly, are classified as Level 3. The valuation technique for these
securities is discussed in more detail in “Note 8—Goodwill and Other Intangible Assets.”
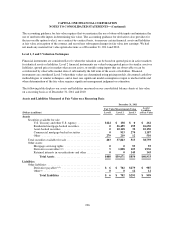
Financial liabilities
Interest Bearing Deposits
The fair value of other interest-bearing deposits was determined based on discounted expected cash flows using
discount rates consistent with current market rates for similar products with similar remaining terms.
Non-Interest Bearing Deposits
The carrying amount of non-interest bearing deposits approximates fair value.
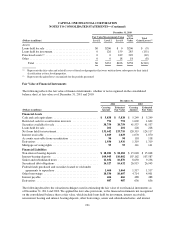
Senior and Subordinated Notes
We engage multiple third party pricing services in order to estimate the fair value of senior and subordinated
notes. The pricing service utilizes a pricing model that incorporates available trade, bid and other market
information. It also incorporates spread assumptions, volatility assumptions and relevant credit information into
the pricing models.
Securitized Debt Obligations
We utilized multiple third party pricing services to obtain fair value measures for the large majority of our
securitized debt obligations. The techniques used by the pricing services utilize observable market data to the
extent available; and pricing models may be used which incorporate available trade, bid and other market
information as described in the above section. We used internal pricing models, discounted cash flow models or
similar techniques to estimate the fair value of certain securitization trusts where third party pricing was not
available.
Other Borrowings
The carrying amount of federal funds purchased and repurchase agreements, FHLB advances, and other short-
term borrowings approximates fair value. The fair value of junior subordinated borrowings was estimated using
the same methodology as described for senior and subordinated notes. The fair value of other borrowings was
determined based on trade information for bonds with similar duration and credit quality, adjusted to incorporate
any relevant credit information of the issuer. The increase in fair value of other borrowings above carrying values
at December 31, 2011 was primarily due to interest rate spreads across the industry.
Interest Payable
The carrying amount of interest payable approximates the fair value of this liability due to its relatively short-
term nature.
234