Capital One 2011 Annual Report Download - page 82
Download and view the complete annual report
Please find page 82 of the 2011 Capital One annual report below. You can navigate through the pages in the report by either clicking on the pages listed below, or by using the keyword search tool below to find specific information within the annual report.-
 1
1 -
2
-
3
-
4
-
5
-
6
-
7
-
8
-
9
-
10
-
11
-
12
-
13
-
14
-
15
-
16
-
17
-
18
-
19
-
20
-
21
-
22
-
23
-
24
-
25
-
26
-
27
-
28
-
29
-
30
-
31
-
32
-
33
-
34
-
35
-
36
-
37
-
38
-
39
-
40
-
41
-
42
-
43
-
44
-
45
-
46
-
47
-
48
-
49
-
50
-
51
-
52
-
53
-
54
-
55
-
56
-
57
-
58
-
59
-
60
-
61
-
62
-
63
-
64
-
65
-
66
-
67
-
68
-
69
-
70
-
71
-
 72
72 -
 73
73 -
 74
74 -
 75
75 -
 76
76 -
 77
77 -
 78
78 -
 79
79 -
 80
80 -
 81
81 -
 82
82 -
 83
83 -
 84
84 -
 85
85 -
 86
86 -
 87
87 -
 88
88 -
 89
89 -
 90
90 -
 91
91 -
 92
92 -
93
-
94
-
95
-
96
-
97
-
98
-
99
-
100
-
101
-
102
-
103
-
104
-
105
-
106
-
107
-
108
-
109
-
110
-
111
-
112
-
113
-
114
-
115
-
116
-
117
-
118
-
119
-
120
-
121
-
122
-
123
-
124
-
125
-
126
-
127
-
128
-
129
-
130
-
131
-
132
-
133
-
134
-
135
-
136
-
137
-
138
-
139
-
140
-
141
-
142
-
143
-
144
-
145
-
146
-
147
-
148
-
149
-
150
-
151
-
152
-
153
-
154
-
155
-
156
-
157
-
158
-
159
-
160
-
161
-
162
-
163
-
164
-
165
-
166
-
167
-
168
-
169
-
170
-
171
-
172
-
173
-
174
-
175
-
176
-
177
-
178
-
179
-
180
-
181
-
182
-
183
-
184
-
185
-
186
-
187
-
188
-
189
-
190
-
191
-
192
-
193
-
194
-
195
-
196
-
197
-
198
-
199
-
200
-
201
-
202
-
203
-
204
-
205
-
206
-
207
-
208
-
209
-
210
-
211
-
212
-
213
-
214
-
215
-
216
-
217
-
218
-
219
-
220
-
221
-
222
-
223
-
224
-
225
-
226
-
227
-
228
-
229
-
230
-
231
-
232
-
233
-
234
-
235
-
236
-
237
-
238
-
239
-
240
-
241
-
242
-
243
-
244
-
245
-
246
-
247
-
248
-
249
-
250
-
251
-
252
-
253
-
254
-
255
-
256
-
257
-
258
-
259
-
260
-
261
-
262
-
263
-
264
-
265
-
266
-
267
-
268
-
269
-
270
-
271
-
272
-
273
-
274
-
275
-
276
-
277
-
278
-
279
-
280
-
281
-
282
-
283
-
284
-
285
-
286
-
287
-
288
-
289
-
290
-
291
-
292
-
293
-
294
-
295
-
296
-
297
-
298
 |
 |

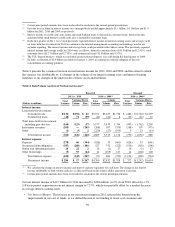
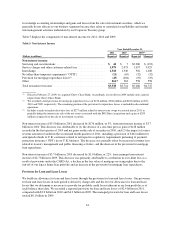
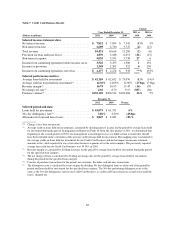
The decrease in the provision in 2011 and 2010 was largely driven by a substantial decline in net charge-offs
across all of our business segments, reflecting the improvement in the credit performance of our loan portfolio.
As a result, we recorded significant reductions in our allowance in 2011 and 2010. Our allowance releases were
significantly lower in 2011 relative to 2010, reflecting a stabilization of the improvement in credit trends and
growth in our loan portfolio.
Table 30 below, under “Credit Risk Profile—Summary of Allowance for Loan and Lease Losses” summarizes
changes in our allowance for loan and lease losses and details the provision for loan and lease losses recognized
in our consolidated statements of income and the charge-offs recorded against our allowance for loan and lease
losses in 2011, 2010 and 2009.
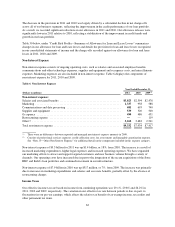
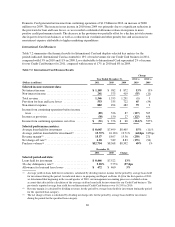
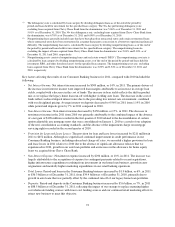
Non-Interest Expense
Non-interest expense consists of ongoing operating costs, such as salaries and associated employee benefits,
communications and other technology expenses, supplies and equipment and occupancy costs, and miscellaneous
expenses. Marketing expenses are also included in non-interest expense. Table 6 displays the components of
non-interest expense for 2011, 2010 and 2009.
Table 6: Non-Interest Expense
Year Ended December 31,
(Dollars in millions) 2011 2010 2009(1)
Non-interest expense:
Salaries and associated benefits ........................................... $3,023 $2,594 $2,478
Marketing ............................................................ 1,337 958 588
Communications and data processing ...................................... 681 693 740
Supplies and equipment ................................................. 539 520 500
Occupancy ........................................................... 490 486 451
Restructuring expense .................................................. —— 119
Other(2) .............................................................. 3,262 2,683 2,541
Total non-interest expense ............................................... $9,332 $7,934 $7,417
(1) There were no differences between reported and managed non-interest expense amounts in 2009.
(2) Consists of professional services expenses, credit collection costs, fee assessments and intangible amortization expense.
See “Note 15—Other Non-Interest Expense” for additional detail on the components included in this expense category.
Non-interest expense of $9.3 billion for 2011 was up $1.4 billion, or 18%, from 2010. The increase is a result of
increased marketing expenditures, higher legal expenses and increased operating expenses. We have expanded
our marketing efforts to attract and support targeted customers and new business volume through a variety of
channels. Our operating costs have increased due in part to the integration of the recent acquisitions of the Sony,
HBC and Kohl’s loan portfolios and continued investment in our infrastructure.
Non-interest expense of $7.9 billion in 2010 was up $517 million, or 7%, from 2009. The increase was primarily
due to increases in marketing expenditures and salaries and associate benefits, partially offset by the absence of
restructuring charges.
Income Taxes
Our effective income tax rate based on income from continuing operations was 29.1%, 29.6% and 26.2% in
2011, 2010 and 2009, respectively. The variation in our effective tax rate between periods is due, in part, to
fluctuations in our pre-tax earnings, which affects the relative tax benefit of tax-exempt income, tax credits and
other permanent tax items.
62