Capital One 2011 Annual Report Download - page 92
Download and view the complete annual report
Please find page 92 of the 2011 Capital One annual report below. You can navigate through the pages in the report by either clicking on the pages listed below, or by using the keyword search tool below to find specific information within the annual report.-
 1
1 -
2
-
3
-
4
-
5
-
6
-
7
-
8
-
9
-
10
-
11
-
12
-
13
-
14
-
15
-
16
-
17
-
18
-
19
-
20
-
21
-
22
-
23
-
24
-
25
-
26
-
27
-
28
-
29
-
30
-
31
-
32
-
33
-
34
-
35
-
36
-
37
-
38
-
39
-
40
-
41
-
42
-
43
-
44
-
45
-
46
-
47
-
48
-
49
-
50
-
51
-
52
-
53
-
54
-
55
-
56
-
57
-
58
-
59
-
60
-
61
-
62
-
63
-
64
-
65
-
66
-
67
-
68
-
69
-
70
-
71
-
72
-
73
-
74
-
75
-
76
-
77
-
78
-
79
-
80
-
81
-
 82
82 -
 83
83 -
 84
84 -
 85
85 -
 86
86 -
 87
87 -
 88
88 -
 89
89 -
 90
90 -
 91
91 -
 92
92 -
 93
93 -
 94
94 -
 95
95 -
 96
96 -
 97
97 -
 98
98 -
 99
99 -
 100
100 -
 101
101 -
 102
102 -
103
-
104
-
105
-
106
-
107
-
108
-
109
-
110
-
111
-
112
-
113
-
114
-
115
-
116
-
117
-
118
-
119
-
120
-
121
-
122
-
123
-
124
-
125
-
126
-
127
-
128
-
129
-
130
-
131
-
132
-
133
-
134
-
135
-
136
-
137
-
138
-
139
-
140
-
141
-
142
-
143
-
144
-
145
-
146
-
147
-
148
-
149
-
150
-
151
-
152
-
153
-
154
-
155
-
156
-
157
-
158
-
159
-
160
-
161
-
162
-
163
-
164
-
165
-
166
-
167
-
168
-
169
-
170
-
171
-
172
-
173
-
174
-
175
-
176
-
177
-
178
-
179
-
180
-
181
-
182
-
183
-
184
-
185
-
186
-
187
-
188
-
189
-
190
-
191
-
192
-
193
-
194
-
195
-
196
-
197
-
198
-
199
-
200
-
201
-
202
-
203
-
204
-
205
-
206
-
207
-
208
-
209
-
210
-
211
-
212
-
213
-
214
-
215
-
216
-
217
-
218
-
219
-
220
-
221
-
222
-
223
-
224
-
225
-
226
-
227
-
228
-
229
-
230
-
231
-
232
-
233
-
234
-
235
-
236
-
237
-
238
-
239
-
240
-
241
-
242
-
243
-
244
-
245
-
246
-
247
-
248
-
249
-
250
-
251
-
252
-
253
-
254
-
255
-
256
-
257
-
258
-
259
-
260
-
261
-
262
-
263
-
264
-
265
-
266
-
267
-
268
-
269
-
270
-
271
-
272
-
273
-
274
-
275
-
276
-
277
-
278
-
279
-
280
-
281
-
282
-
283
-
284
-
285
-
286
-
287
-
288
-
289
-
290
-
291
-
292
-
293
-
294
-
295
-
296
-
297
-
298
 |
 |
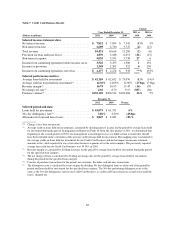
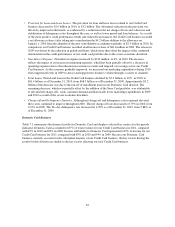
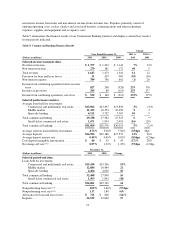
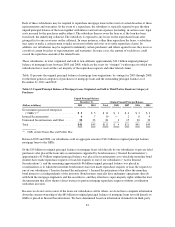
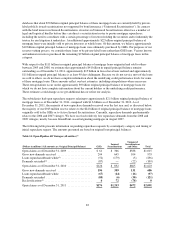
(3) The delinquency rate is calculated by loan category by dividing delinquent loans as of the end of the period by
period-end loans held for investment for the specified loan category. The 30+ day performing delinquency rate,
excluding loans acquired from Chevy Chase Bank from the denominator, was 5.06% as of December 31, 2011 and
5.01% as of December 31, 2010. The 30+ day delinquency rate, excluding loans acquired from Chevy Chase Bank from
the denominator, was 6.78% as of December 31, 2011 and 6.98% as of December 31, 2010.
(4) Nonperforming loans generally include loans that have been placed on nonaccrual status and certain restructured loans
whose contractual terms have been restructured in a manner that grants a concession to a borrower experiencing financial
difficulty. The nonperforming loan rate is calculated by loan category by dividing nonperforming loans as of the end of
the period by period-end loans held for investment for the specified loan category. The nonperforming loan rate,
excluding the impact of loans acquired from Chevy Chase Bank from the denominator, was 2.03% and 2.30% as of
December 31, 2011 and 2010, respectively.
(5) Nonperforming assets consist of nonperforming loans and real estate owned (“REO”). The nonperforming asset rate is
calculated by loan category by dividing nonperforming assets as of the end of the period by period-end loans held for
investment, REO, and other foreclosed assets for the specified loan category. The nonperforming asset rate, excluding
loans acquired from Chevy Chase Bank from the denominator, was 2.20% and 2.54% as of December 31, 2011 and
2010, respectively.
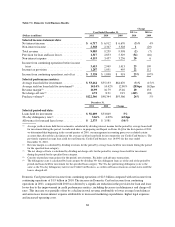
Key factors affecting the results of our Consumer Banking business for 2011, compared with 2010 included the
following:
•Net Interest Income: Net interest income increased by $509 million, or 14%, in 2011. The primary drivers of
the increase in net interest income were improved loan margins attributable to an increase in average loan
yields, coupled with a decrease in the cost of funds. The increase in loan yields reflects the shift in product
mix as we replace the legacy home loan run-off with higher yielding auto loans. The decrease in the cost of
funds reflects reduced deposit interest rates due to the prevailing low interest rate environment, combined
with our disciplined pricing. Average interest on deposits decreased to 0.96% in 2011 from 1.19% in 2010
while period end deposits grew by 7% in 2011 compared to 2010.
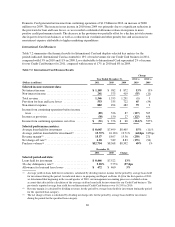
•Non-Interest Income: Non-interest income decreased by $150 million, or 17%, in 2011. The decrease in
non-interest income in the 2011 from 2010 was primarily attributable to the combined impact of the absence
of a net gain of $128 million recorded in the first quarter of 2010 related to the deconsolidation of certain
option-adjustable rate mortgage trusts that were consolidated on January 1, 2010 as a result of our adoption
of the new consolidation accounting standards, and the absence of the impairment charge on mortgage
servicing rights recorded in the second quarter of 2010.
•Provision for Loan and Lease Losses: The provision for loan and lease losses increased by $211 million in
2011 to $452 million. Although we experienced continued improvement in credit performance in our
Consumer Banking business, including reduced net charge-off rates, we recorded a higher provision for loan
and lease losses in 2011 relative to 2010 due to the absence of significant allowance releases that we
experienced in 2010, growth in our auto loan portfolio and an increase in the allowance for home equity
loans we acquired from Chevy Chase Bank.
•Non-Interest Expense: Non-interest expense increased by $294 million, or 10%, in 2011. The increase was
largely attributable to the recognition of expense for contingent payments related to recent acquisitions,
higher infrastructure expenditures resulting from investments in our home loan business, growth in auto
originations and modestly higher marketing expenditures in our retail banking operations.
•Total Loans: Period-end loans in the Consumer Banking business increased by $1.9 billion, or 6%, in 2011
to $36.3 billion as of December 31, 2011, from $34.4 billion as of December 31, 2010, primarily due to
growth in auto loans that was partially offset by the continued run-off of our legacy home loan portfolios.
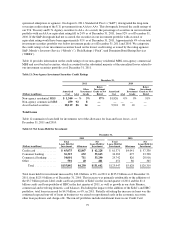
•Deposits: Period-end deposits in the Consumer Banking business increased by $5.6 billion, or 7%, in 2011
to $88.5 billion as of December 31, 2011, reflecting the impact of our strategy to replace maturing higher
cost wholesale funding sources with lower cost funding sources and our continued retail marketing efforts to
attract new business to meet this objective.
72