Capital One 2011 Annual Report Download - page 64
Download and view the complete annual report
Please find page 64 of the 2011 Capital One annual report below. You can navigate through the pages in the report by either clicking on the pages listed below, or by using the keyword search tool below to find specific information within the annual report.-
 1
1 -
2
-
3
-
4
-
5
-
6
-
7
-
8
-
9
-
10
-
11
-
12
-
13
-
14
-
15
-
16
-
17
-
18
-
19
-
20
-
21
-
22
-
23
-
24
-
25
-
26
-
27
-
28
-
29
-
30
-
31
-
32
-
33
-
34
-
35
-
36
-
37
-
38
-
39
-
40
-
41
-
42
-
43
-
44
-
45
-
46
-
47
-
48
-
49
-
50
-
51
-
52
-
53
-
 54
54 -
 55
55 -
 56
56 -
 57
57 -
 58
58 -
 59
59 -
 60
60 -
 61
61 -
 62
62 -
 63
63 -
 64
64 -
 65
65 -
 66
66 -
 67
67 -
 68
68 -
 69
69 -
 70
70 -
 71
71 -
 72
72 -
 73
73 -
 74
74 -
75
-
76
-
77
-
78
-
79
-
80
-
81
-
82
-
83
-
84
-
85
-
86
-
87
-
88
-
89
-
90
-
91
-
92
-
93
-
94
-
95
-
96
-
97
-
98
-
99
-
100
-
101
-
102
-
103
-
104
-
105
-
106
-
107
-
108
-
109
-
110
-
111
-
112
-
113
-
114
-
115
-
116
-
117
-
118
-
119
-
120
-
121
-
122
-
123
-
124
-
125
-
126
-
127
-
128
-
129
-
130
-
131
-
132
-
133
-
134
-
135
-
136
-
137
-
138
-
139
-
140
-
141
-
142
-
143
-
144
-
145
-
146
-
147
-
148
-
149
-
150
-
151
-
152
-
153
-
154
-
155
-
156
-
157
-
158
-
159
-
160
-
161
-
162
-
163
-
164
-
165
-
166
-
167
-
168
-
169
-
170
-
171
-
172
-
173
-
174
-
175
-
176
-
177
-
178
-
179
-
180
-
181
-
182
-
183
-
184
-
185
-
186
-
187
-
188
-
189
-
190
-
191
-
192
-
193
-
194
-
195
-
196
-
197
-
198
-
199
-
200
-
201
-
202
-
203
-
204
-
205
-
206
-
207
-
208
-
209
-
210
-
211
-
212
-
213
-
214
-
215
-
216
-
217
-
218
-
219
-
220
-
221
-
222
-
223
-
224
-
225
-
226
-
227
-
228
-
229
-
230
-
231
-
232
-
233
-
234
-
235
-
236
-
237
-
238
-
239
-
240
-
241
-
242
-
243
-
244
-
245
-
246
-
247
-
248
-
249
-
250
-
251
-
252
-
253
-
254
-
255
-
256
-
257
-
258
-
259
-
260
-
261
-
262
-
263
-
264
-
265
-
266
-
267
-
268
-
269
-
270
-
271
-
272
-
273
-
274
-
275
-
276
-
277
-
278
-
279
-
280
-
281
-
282
-
283
-
284
-
285
-
286
-
287
-
288
-
289
-
290
-
291
-
292
-
293
-
294
-
295
-
296
-
297
-
298
 |
 |
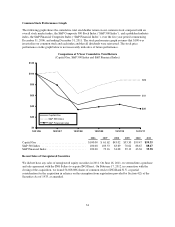
Below are additional highlights of our performance for 2011. These highlights generally are based on a
comparison between our 2011 and 2010 results. The changes in our financial condition and credit performance
are generally based on our financial condition and credit performance as of December 31, 2011, compared with
our financial condition and credit performance as of December 31, 2010. We provide a more detailed discussion
of our financial performance in the sections following this “Executive Summary and Business Outlook.”
Total Company
•Earnings: Our earnings of $3.1 billion in 2011 increased by $404 million, or 15%, from 2010. The increase
in net income was primarily attributable to significantly lower credit costs due to improvements in loan
credit quality. The increase in net income for 2011 also reflected a substantial reduction in the provision for
mortgage repurchase losses for legacy mortgage-related representation and warranty claims. These factors
were partially offset by higher operating expenses primarily due to continued investment in growing our
businesses, accelerating the building of our infrastructure and increased marketing expenditures.
•Total Loans: Period-end loans held for investment increased by $10.0 billion, or 8%, in 2011, to $135.9
billion as of December 31, 2011, from $125.9 billion as of December 31, 2010. The increase was primarily
attributable to growth in our Credit Card, Commercial Banking, and Auto Finance businesses, which
included the additions of the $1.4 billion HBC credit card loan portfolio in the first quarter of 2011 and the
$3.7 billion Kohl’s private-label credit card loan portfolio in the second quarter of 2011. Excluding the
impact of the additions of the HBC and Kohl’s credit card loan portfolios, total loans increased by $4.9
billion, or 4%, in 2011, due to strong purchase volume growth across the Domestic Card business, a
significant increase in auto loan originations and steady loan growth in our Commercial Banking business.
The impact from these factors was partially offset by the continued expected run-off of installment loans in
our Credit Card business and legacy home loans in our Consumer Banking business, other loan paydowns
and charge-offs.
•Charge-off and Delinquency Statistics: Our net charge-off rate declined by 224 basis points to 2.94% in
2011, from 5.18% in 2010. The 30+ day delinquency rate also declined during the year to 3.95% as of
December 31, 2011, from 4.23% as of December 31, 2010. The improvement in overall credit trends
reflected the impact from strong underlying credit performance and tighter underwriting standards.
•Allowance for Loan and Lease Losses: We reduced our allowance by $1.4 billion in 2011 to $4.3 billion as
of December 31, 2011. In comparison, after taking into consideration the allowance build resulting from the
January 1, 2010 adoption of the new consolidation accounting standards, we reduced our allowance by $2.8
billion in 2010. The significant reduction in the allowance release in 2011 from the allowance release in
2010 reflected the impact of stabilizing credit trends in 2011. While our net-charge off rate improved by 224
basis points in 2011 from 2010, the allowance coverage ratio decreased by only 134 basis points to 3.13% as
of December 31, 2011, from 4.47% as of December 31, 2010.
•Representation and Warranty Reserve: Our representation and warranty reserve totaled $943 million as of
December 31, 2011, compared with $816 million as of December 31, 2010. This reserve, which relates to
our mortgage loan repurchase exposure for legacy mortgage loans sold by our subsidiaries to various parties
under contractual provisions that include various representations and warranties, reflects losses as of each
balance sheet date that we consider to be both probable and reasonably estimable. We recorded a provision
for this exposure of $212 million in 2011, compared with a provision of $636 million in 2010.
Business Segments
•Credit Card: Our Credit Card business generated net income from continuing operations of $2.3 billion in
2011, the same level as net income from continuing operations in 2010. Our Credit Card business results for
2011 reflected the benefit from improved credit performance, which resulted in a significant decrease in the
provision for loan and lease losses. The provision decrease, however, was offset by an increase in
non-interest expense attributable to increased operating and integration costs related to the acquisitions of
44