Capital One 2011 Annual Report Download - page 251
Download and view the complete annual report
Please find page 251 of the 2011 Capital One annual report below. You can navigate through the pages in the report by either clicking on the pages listed below, or by using the keyword search tool below to find specific information within the annual report.-
 1
1 -
2
-
3
-
4
-
5
-
6
-
7
-
8
-
9
-
10
-
11
-
12
-
13
-
14
-
15
-
16
-
17
-
18
-
19
-
20
-
21
-
22
-
23
-
24
-
25
-
26
-
27
-
28
-
29
-
30
-
31
-
32
-
33
-
34
-
35
-
36
-
37
-
38
-
39
-
40
-
41
-
42
-
43
-
44
-
45
-
46
-
47
-
48
-
49
-
50
-
51
-
52
-
53
-
54
-
55
-
56
-
57
-
58
-
59
-
60
-
61
-
62
-
63
-
64
-
65
-
66
-
67
-
68
-
69
-
70
-
71
-
72
-
73
-
74
-
75
-
76
-
77
-
78
-
79
-
80
-
81
-
82
-
83
-
84
-
85
-
86
-
87
-
88
-
89
-
90
-
91
-
92
-
93
-
94
-
95
-
96
-
97
-
98
-
99
-
100
-
101
-
102
-
103
-
104
-
105
-
106
-
107
-
108
-
109
-
110
-
111
-
112
-
113
-
114
-
115
-
116
-
117
-
118
-
119
-
120
-
121
-
122
-
123
-
124
-
125
-
126
-
127
-
128
-
129
-
130
-
131
-
132
-
133
-
134
-
135
-
136
-
137
-
138
-
139
-
140
-
141
-
142
-
143
-
144
-
145
-
146
-
147
-
148
-
149
-
150
-
151
-
152
-
153
-
154
-
155
-
156
-
157
-
158
-
159
-
160
-
161
-
162
-
163
-
164
-
165
-
166
-
167
-
168
-
169
-
170
-
171
-
172
-
173
-
174
-
175
-
176
-
177
-
178
-
179
-
180
-
181
-
182
-
183
-
184
-
185
-
186
-
187
-
188
-
189
-
190
-
191
-
192
-
193
-
194
-
195
-
196
-
197
-
198
-
199
-
200
-
201
-
202
-
203
-
204
-
205
-
206
-
207
-
208
-
209
-
210
-
211
-
212
-
213
-
214
-
215
-
216
-
217
-
218
-
219
-
220
-
221
-
222
-
223
-
224
-
225
-
226
-
227
-
228
-
229
-
230
-
231
-
232
-
233
-
234
-
235
-
236
-
237
-
238
-
239
-
240
-
 241
241 -
 242
242 -
 243
243 -
 244
244 -
 245
245 -
 246
246 -
 247
247 -
 248
248 -
 249
249 -
 250
250 -
 251
251 -
 252
252 -
 253
253 -
 254
254 -
 255
255 -
 256
256 -
 257
257 -
 258
258 -
 259
259 -
 260
260 -
 261
261 -
262
-
263
-
264
-
265
-
266
-
267
-
268
-
269
-
270
-
271
-
272
-
273
-
274
-
275
-
276
-
277
-
278
-
279
-
280
-
281
-
282
-
283
-
284
-
285
-
286
-
287
-
288
-
289
-
290
-
291
-
292
-
293
-
294
-
295
-
296
-
297
-
298
 |
 |

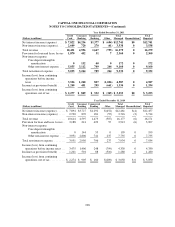
CAPITAL ONE FINANCIAL CORPORATION
NOTES TO CONSOLIDATED STATEMENTS—(Continued)
December 31, 2010
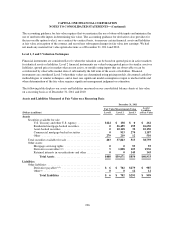
Fair Value Measurements Using Assets
at Fair
Value
Total
Gains/(Losses)(2)
(Dollars in millions) Level 1 Level 2 Level 3
Assets
Loans held for sale ............................... $0 $206 $ 0 $206 $ (9)
Loans held for investment ......................... 0 126 159 285 (151)
Foreclosed assets(1) ............................... 0 0 249 249 (42)
Other .......................................... 0 0 18 18 (8)
Total ...................................... $0 $332 $426 $758 $(210)
(1) Represents the fair value and related losses of foreclosed properties that were written down subsequent to their initial
classification as foreclosed properties.
(2) Represents the gains/losses recognized for the periods presented.
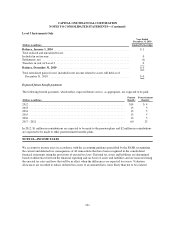
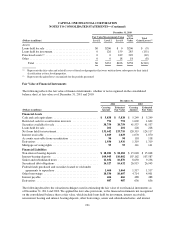
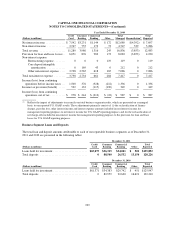
Fair Value of Financial Instruments
The following reflects the fair value of financial instruments, whether or not recognized on the consolidated
balance sheet, at fair value as of December 31, 2011 and 2010:
December 31,
2011 2010
(Dollars in millions)
Carrying
Amount
Estimated
Fair Value
Carrying
Amount
Estimated
Fair Value
Financial Assets
Cash and cash equivalents ............................... $ 5,838 $ 5,838 $ 5,249 $ 5,249
Restricted cash for securitization investors .................. 791 791 1,602 1,602
Securities available for sale .............................. 38,759 38,759 41,537 41,537
Loans held for sale ..................................... 201 201 228 228
Net loans held for investment ............................. 131,642 133,710 120,319 124,117
Interest receivable ..................................... 1,029 1,029 1,070 1,070
Accounts receivable from securitization .................... 94 94 118 118
Derivatives ........................................... 1,936 1,936 1,319 1,319
Mortgage servicing rights ................................ 93 93 141 141
Financial Liabilities
Non-interest bearing deposits ............................. $ 18,281 $ 18,281 $ 15,048 $ 15,048
Interest-bearing deposits ................................ 109,945 110,002 107,162 107,587
Senior and subordinated notes ............................ 11,034 10,870 8,650 9,236
Securitized debt obligations .............................. 16,527 16,632 26,915 26,943
Federal funds purchased and securities loaned or sold under
agreements to repurchase .............................. 1,464 1,464 1,517 1,517
Other borrowings ...................................... 10,536 10,607 4,714 4,901
Interest payable ....................................... 466 466 488 488
Derivatives ........................................... 987 987 636 636
The following describes the valuation techniques used in estimating the fair value of our financial instruments as
of December 31, 2011 and 2010. We applied the fair value provisions,to the financial instruments not recognized
on the consolidated balance sheet at fair value, which include loans held for investment, interest receivable,
non-interest bearing and interest bearing deposits, other borrowings, senior and subordinated notes, and interest
231