Capital One 2011 Annual Report Download - page 294
Download and view the complete annual report
Please find page 294 of the 2011 Capital One annual report below. You can navigate through the pages in the report by either clicking on the pages listed below, or by using the keyword search tool below to find specific information within the annual report.-
 1
1 -
2
-
3
-
4
-
5
-
6
-
7
-
8
-
9
-
10
-
11
-
12
-
13
-
14
-
15
-
16
-
17
-
18
-
19
-
20
-
21
-
22
-
23
-
24
-
25
-
26
-
27
-
28
-
29
-
30
-
31
-
32
-
33
-
34
-
35
-
36
-
37
-
38
-
39
-
40
-
41
-
42
-
43
-
44
-
45
-
46
-
47
-
48
-
49
-
50
-
51
-
52
-
53
-
54
-
55
-
56
-
57
-
58
-
59
-
60
-
61
-
62
-
63
-
64
-
65
-
66
-
67
-
68
-
69
-
70
-
71
-
72
-
73
-
74
-
75
-
76
-
77
-
78
-
79
-
80
-
81
-
82
-
83
-
84
-
85
-
86
-
87
-
88
-
89
-
90
-
91
-
92
-
93
-
94
-
95
-
96
-
97
-
98
-
99
-
100
-
101
-
102
-
103
-
104
-
105
-
106
-
107
-
108
-
109
-
110
-
111
-
112
-
113
-
114
-
115
-
116
-
117
-
118
-
119
-
120
-
121
-
122
-
123
-
124
-
125
-
126
-
127
-
128
-
129
-
130
-
131
-
132
-
133
-
134
-
135
-
136
-
137
-
138
-
139
-
140
-
141
-
142
-
143
-
144
-
145
-
146
-
147
-
148
-
149
-
150
-
151
-
152
-
153
-
154
-
155
-
156
-
157
-
158
-
159
-
160
-
161
-
162
-
163
-
164
-
165
-
166
-
167
-
168
-
169
-
170
-
171
-
172
-
173
-
174
-
175
-
176
-
177
-
178
-
179
-
180
-
181
-
182
-
183
-
184
-
185
-
186
-
187
-
188
-
189
-
190
-
191
-
192
-
193
-
194
-
195
-
196
-
197
-
198
-
199
-
200
-
201
-
202
-
203
-
204
-
205
-
206
-
207
-
208
-
209
-
210
-
211
-
212
-
213
-
214
-
215
-
216
-
217
-
218
-
219
-
220
-
221
-
222
-
223
-
224
-
225
-
226
-
227
-
228
-
229
-
230
-
231
-
232
-
233
-
234
-
235
-
236
-
237
-
238
-
239
-
240
-
241
-
242
-
243
-
244
-
245
-
246
-
247
-
248
-
249
-
250
-
251
-
252
-
253
-
254
-
255
-
256
-
257
-
258
-
259
-
260
-
261
-
262
-
263
-
264
-
265
-
266
-
267
-
268
-
269
-
270
-
271
-
272
-
273
-
274
-
275
-
276
-
277
-
278
-
279
-
280
-
281
-
282
-
283
-
 284
284 -
 285
285 -
 286
286 -
 287
287 -
 288
288 -
 289
289 -
 290
290 -
 291
291 -
 292
292 -
 293
293 -
 294
294 -
 295
295 -
 296
296 -
 297
297 -
 298
298
 |
 |

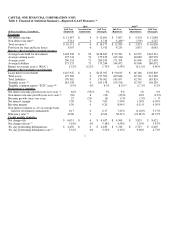
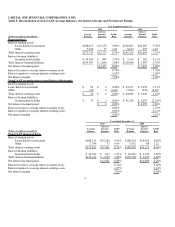
CAPITAL ONE FINANCIAL CORPORATION (COF)
Table 3: Reconciliation of Non-GAAP Average Balances, Net Interest Income and Net Interest Margin
3
Year Ended December 31,
2010 2009
(Dollars in millions)(unaudited)
Average
Balance
Interes
t
Income/
Ex
p
ense
Yield/
Rate
Average
Balance
Interes
t
Income/
Ex
p
ense
Yield/
Rate
Reported basis
Interest-earning assets:
Loans held for investment
$168,015
$15,276
9.09%
$136,697
$10,367
7.58%
Other
7,726 77
1.00 8,613
297 3.45
Total interest-earning assets
$175,741
$15,353
8.74%
$145,31
0
$10,664
7.34%
Interest-bearin
g
liabilities:
Securitization liabilit
y
$ 34,185
$ 809
2.37%
$ 5,516
$ 282
5.11%
Total interest-bearin
g
liabilities
$154,363
$ 2,896
1.88%
$126,60
0
$ 2,967
2.34%
Net interest income/spread
$12,457
6.86%
$ 7,697
5.00%
Interest income to average interest-earning assets
8.74%
7.34%
Interest ex
p
ense to avera
g
e interest-earnin
g
assets
1.65%
2.04%
Net interest margin
7.09%
5.30%
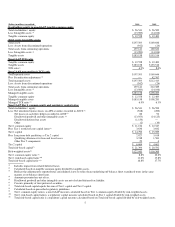
Non-GAAP securitization reconciliation adjustments
Interest-earning assets:
Loans held for investment
$ 96
$ 8
0.00%
$ 43,727
$ 5,678
1.31%
Other
(22)
0
(0.01)
(3,061)
(229)
(2.23)
Total interest-earning assets
$ 74
$ 8
0.00%
$ 40,666
$ 5,449
1.32%
Interest-bearing liabilities:
Securitization liability
$ 79 $ 4
0.00% $ 41,10
0
$ 1,057 (2.24)%
Net interest income/spread
$ 4
0.00%
$ 4,392
1.26%
Interest income to average interest-earning assets
0.00%
1.32%
Interest expense to average interest-earning assets
0.00%
0.12%
Net interest mar
g
in
0.00%
1.10%
Year Ended December 31,
2010 2009
(Dollars in millions)(unaudited)
Average
Balance
Interest
Income/
Expense
Yield/
Rate
Average
Balance
Interest
Income/
Expense
Yield/
Rate
Non-GAAP managed basis
Interest-earning assets:
Loans held for investment
$168,111
$15,284
9.09%
$180,424
$16,045
8.89%
Other
7,704
77
0.99
5,552
68
1.22
Total interest-earning assets
$175,815
$15,361
8.74% $185,976
$16,113
8.66%
Interest-bearing liabilities:
Securitization liabilit
y
$ 34,264
$ 813
2.37% $ 46,616
$ 1,339
2.87%
Total interest-bearin
g
liabilities
$154,443
$ 2,900
1.88% $167,70
0
$ 4,024
2.40%
Net interest income/spread
$12,461
6.86%
$12,089
6.26%
Interest income to avera
g
e interest-earnin
g
assets
8.74%
8.66%
Interest expense to average interest-earning assets
1.65%
2.16%
Net interest margin
7.09%
6.50%