Capital One 2011 Annual Report Download - page 90
Download and view the complete annual report
Please find page 90 of the 2011 Capital One annual report below. You can navigate through the pages in the report by either clicking on the pages listed below, or by using the keyword search tool below to find specific information within the annual report.-
 1
1 -
2
-
3
-
4
-
5
-
6
-
7
-
8
-
9
-
10
-
11
-
12
-
13
-
14
-
15
-
16
-
17
-
18
-
19
-
20
-
21
-
22
-
23
-
24
-
25
-
26
-
27
-
28
-
29
-
30
-
31
-
32
-
33
-
34
-
35
-
36
-
37
-
38
-
39
-
40
-
41
-
42
-
43
-
44
-
45
-
46
-
47
-
48
-
49
-
50
-
51
-
52
-
53
-
54
-
55
-
56
-
57
-
58
-
59
-
60
-
61
-
62
-
63
-
64
-
65
-
66
-
67
-
68
-
69
-
70
-
71
-
72
-
73
-
74
-
75
-
76
-
77
-
78
-
79
-
 80
80 -
 81
81 -
 82
82 -
 83
83 -
 84
84 -
 85
85 -
 86
86 -
 87
87 -
 88
88 -
 89
89 -
 90
90 -
 91
91 -
 92
92 -
 93
93 -
 94
94 -
 95
95 -
 96
96 -
 97
97 -
 98
98 -
 99
99 -
 100
100 -
101
-
102
-
103
-
104
-
105
-
106
-
107
-
108
-
109
-
110
-
111
-
112
-
113
-
114
-
115
-
116
-
117
-
118
-
119
-
120
-
121
-
122
-
123
-
124
-
125
-
126
-
127
-
128
-
129
-
130
-
131
-
132
-
133
-
134
-
135
-
136
-
137
-
138
-
139
-
140
-
141
-
142
-
143
-
144
-
145
-
146
-
147
-
148
-
149
-
150
-
151
-
152
-
153
-
154
-
155
-
156
-
157
-
158
-
159
-
160
-
161
-
162
-
163
-
164
-
165
-
166
-
167
-
168
-
169
-
170
-
171
-
172
-
173
-
174
-
175
-
176
-
177
-
178
-
179
-
180
-
181
-
182
-
183
-
184
-
185
-
186
-
187
-
188
-
189
-
190
-
191
-
192
-
193
-
194
-
195
-
196
-
197
-
198
-
199
-
200
-
201
-
202
-
203
-
204
-
205
-
206
-
207
-
208
-
209
-
210
-
211
-
212
-
213
-
214
-
215
-
216
-
217
-
218
-
219
-
220
-
221
-
222
-
223
-
224
-
225
-
226
-
227
-
228
-
229
-
230
-
231
-
232
-
233
-
234
-
235
-
236
-
237
-
238
-
239
-
240
-
241
-
242
-
243
-
244
-
245
-
246
-
247
-
248
-
249
-
250
-
251
-
252
-
253
-
254
-
255
-
256
-
257
-
258
-
259
-
260
-
261
-
262
-
263
-
264
-
265
-
266
-
267
-
268
-
269
-
270
-
271
-
272
-
273
-
274
-
275
-
276
-
277
-
278
-
279
-
280
-
281
-
282
-
283
-
284
-
285
-
286
-
287
-
288
-
289
-
290
-
291
-
292
-
293
-
294
-
295
-
296
-
297
-
298
 |
 |
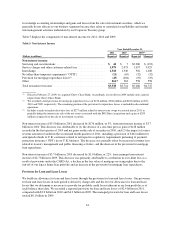
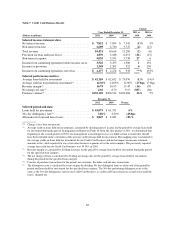
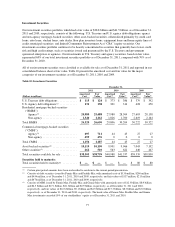
(4) Consists of purchase transactions for the period, net of returns. Excludes cash advance transactions.
(5) The delinquency rate is calculated by loan category by dividing delinquent loans as of the end of the period by
period-end loans held for investment for the specified loan category. The 30+ day performing delinquency rate is the
same as the 30+ day delinquency rate for our Credit Card business, as credit card loans remain on accrual status until the
loan is charged-off.
Our International Card business generated a net loss from continuing operations of $51 million in 2011,
compared with net income from continuing operations of $376 million in 2010. The International Card net loss in
2011, compared with net income in 2010, was driven by: (1) a decrease primarily due to the provision expense of
$174 million recorded in revenue and non-interest expense in the second and fourth quarters of 2011 for the
anticipated refunds to U.K. customers related to retrospective regulatory requirements pertaining to PPI
insurance in our U.K. business; (2) an increase in the provision for loan losses due to the addition of the HBC
loan portfolio and lower allowance releases relative to the same prior year periods; and (3) additional increase in
non-interest expense attributable to increased operating costs associated with HBC associates who joined us as a
result of the acquisition. These factors were partially offset by an increase in net interest income attributable to
higher loan balances.
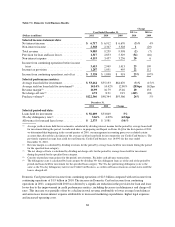
Our International Card business generated net income from continuing operations of $376 million in 2010, an
increase of $316 million from 2009. The most significant driver of the improvement in results was a $387 million
decrease in the provision for loan and lease losses in 2010. As a result of decreases in charge-off and delinquency
rates, we recorded a substantial allowance release of $246 million in 2010, compared with an allowance release
of $20 million in 2009. In addition, total revenue increased by $64 million, primarily due to the impact of pricing
changes implemented during 2009 that resulted in increases in average asset yields that were partially offset by a
decline in loan balances.
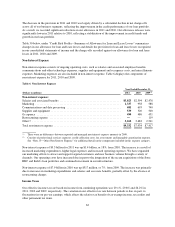
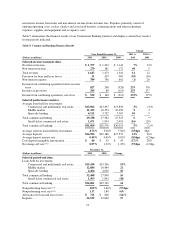
Consumer Banking Business
Our Consumer Banking business generated net income of $809 million in 2011, compared with net income of
$905 million in 2010 and $244 million in 2009. The primary sources of revenue for our Consumer Banking
business are net interest income from loans and deposits and non-interest income from customer fees. Expenses
primarily consist of ongoing operating costs, such as salaries and associated benefits, communications and other
technology expenses, supplies and equipment and occupancy costs.
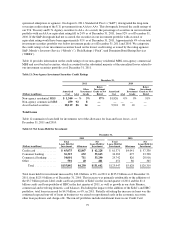
Table 8 summarizes the financial results of our Consumer Banking business and displays selected key metrics for
the periods indicated.
70