Capital One 2011 Annual Report Download - page 203
Download and view the complete annual report
Please find page 203 of the 2011 Capital One annual report below. You can navigate through the pages in the report by either clicking on the pages listed below, or by using the keyword search tool below to find specific information within the annual report.-
 1
1 -
2
-
3
-
4
-
5
-
6
-
7
-
8
-
9
-
10
-
11
-
12
-
13
-
14
-
15
-
16
-
17
-
18
-
19
-
20
-
21
-
22
-
23
-
24
-
25
-
26
-
27
-
28
-
29
-
30
-
31
-
32
-
33
-
34
-
35
-
36
-
37
-
38
-
39
-
40
-
41
-
42
-
43
-
44
-
45
-
46
-
47
-
48
-
49
-
50
-
51
-
52
-
53
-
54
-
55
-
56
-
57
-
58
-
59
-
60
-
61
-
62
-
63
-
64
-
65
-
66
-
67
-
68
-
69
-
70
-
71
-
72
-
73
-
74
-
75
-
76
-
77
-
78
-
79
-
80
-
81
-
82
-
83
-
84
-
85
-
86
-
87
-
88
-
89
-
90
-
91
-
92
-
93
-
94
-
95
-
96
-
97
-
98
-
99
-
100
-
101
-
102
-
103
-
104
-
105
-
106
-
107
-
108
-
109
-
110
-
111
-
112
-
113
-
114
-
115
-
116
-
117
-
118
-
119
-
120
-
121
-
122
-
123
-
124
-
125
-
126
-
127
-
128
-
129
-
130
-
131
-
132
-
133
-
134
-
135
-
136
-
137
-
138
-
139
-
140
-
141
-
142
-
143
-
144
-
145
-
146
-
147
-
148
-
149
-
150
-
151
-
152
-
153
-
154
-
155
-
156
-
157
-
158
-
159
-
160
-
161
-
162
-
163
-
164
-
165
-
166
-
167
-
168
-
169
-
170
-
171
-
172
-
173
-
174
-
175
-
176
-
177
-
178
-
179
-
180
-
181
-
182
-
183
-
184
-
185
-
186
-
187
-
188
-
189
-
190
-
191
-
192
-
 193
193 -
 194
194 -
 195
195 -
 196
196 -
 197
197 -
 198
198 -
 199
199 -
 200
200 -
 201
201 -
 202
202 -
 203
203 -
 204
204 -
 205
205 -
 206
206 -
 207
207 -
 208
208 -
 209
209 -
 210
210 -
 211
211 -
 212
212 -
 213
213 -
214
-
215
-
216
-
217
-
218
-
219
-
220
-
221
-
222
-
223
-
224
-
225
-
226
-
227
-
228
-
229
-
230
-
231
-
232
-
233
-
234
-
235
-
236
-
237
-
238
-
239
-
240
-
241
-
242
-
243
-
244
-
245
-
246
-
247
-
248
-
249
-
250
-
251
-
252
-
253
-
254
-
255
-
256
-
257
-
258
-
259
-
260
-
261
-
262
-
263
-
264
-
265
-
266
-
267
-
268
-
269
-
270
-
271
-
272
-
273
-
274
-
275
-
276
-
277
-
278
-
279
-
280
-
281
-
282
-
283
-
284
-
285
-
286
-
287
-
288
-
289
-
290
-
291
-
292
-
293
-
294
-
295
-
296
-
297
-
298
 |
 |

CAPITAL ONE FINANCIAL CORPORATION
NOTES TO CONSOLIDATED STATEMENTS—(Continued)
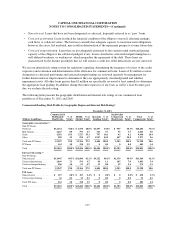
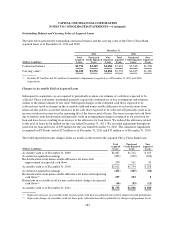
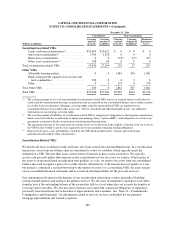
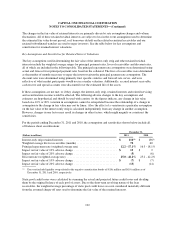
Outstanding Balance and Carrying Value of Acquired Loans
The table below presents the outstanding contractual balance and the carrying value of the Chevy Chase Bank
acquired loans as of December 31, 2011 and 2010:
December 31,
2011 2010
(Dollars in millions)
Total
Acquired
Loans
Purchased
Credit-Impaired
Loans
Non-
Impaired
Loans
Total
Acquired
Loans
Purchased
Credit-Impaired
Loans
Non-
Impaired
Loans
Contractual balance ................... $5,751 $4,565 $1,186 $7,054 $5,546 $1,508
Carrying value(1) ...................... $4,658 $3,576 $1,082 $5,554 $4,165 $1,389
(1) Includes $27 million and $33 million of cumulative impairment recognized as of December 31, 2011 and 2010,
respectively.
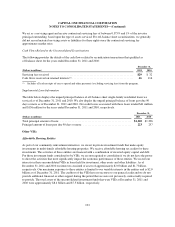
Changes in Accretable Yield of Acquired Loans
Subsequent to acquisition, we are required to periodically evaluate our estimate of cash flows expected to be
collected. These evaluations, performed quarterly, require the continued use of key assumptions and estimates,
similar to the initial estimate of fair value. Subsequent changes in the estimated cash flows expected to be
collected may result in changes in the accretable yield and nonaccretable difference or reclassifications from
nonaccretable yield to accretable. Increases in the cash flows expected to be collected will generally result in an
increase in interest income over the remaining life of the loan or pool of loans. Decreases in expected cash flows
due to further credit deterioration will generally result in an impairment charge recognized in our provision for
loan and lease losses, resulting in an increase to the allowance for loan losses. We reduced the allowance related
to this pool of loans by $6 million for the year ended December 31, 2011. We recorded impairment through our
provision for loan and losses of $33 million for the year ended December 31, 2010. The cumulative impairment
recognized on PCI loans totaled $27 million as of December 31, 2011 and $33 million as of December 31, 2010.
The following table presents changes in the accretable yield related to the acquired Chevy Chase Bank loans:
(Dollars in millions)
Total
Acquired
Loans
Purchased
Credit-Impaired
Loans
Non-
Impaired
Loans
Accretable yield as of December 31, 2009 .......................... $2,067 $1,742 $ 325
Accretion recognized in earnings ................................. (405) (299) (106)
Reclassifications from nonaccretable difference for loans with
improvement in expected cash flows ............................ 350 311 39
Accretable yield as of December 31, 2010 .......................... $2,012 $1,754 $ 258
Accretion recognized in earnings ................................. (431) (365) (66)
Reclassifications from nonaccretable difference for loans with improving
cash flows(1) ............................................... 237 232 5
Reductions in accretable yield for non-credit related changes in expected
cash flows(2) ............................................... (66) (55) (11)
Accretable yield as of December 31, 2011 .......................... $1,752 $1,566 $ 186
(1)
Represents increases in accretable yields for those pools with increases primarily the result of improved credit performance.
(2) Represents changes in accretable yields for those pools with reductions driven primarily by changes in prepayment levels.
183