Capital One 2011 Annual Report Download - page 61
Download and view the complete annual report
Please find page 61 of the 2011 Capital One annual report below. You can navigate through the pages in the report by either clicking on the pages listed below, or by using the keyword search tool below to find specific information within the annual report.-
 1
1 -
2
-
3
-
4
-
5
-
6
-
7
-
8
-
9
-
10
-
11
-
12
-
13
-
14
-
15
-
16
-
17
-
18
-
19
-
20
-
21
-
22
-
23
-
24
-
25
-
26
-
27
-
28
-
29
-
30
-
31
-
32
-
33
-
34
-
35
-
36
-
37
-
38
-
39
-
40
-
41
-
42
-
43
-
44
-
45
-
46
-
47
-
48
-
49
-
50
-
 51
51 -
 52
52 -
 53
53 -
 54
54 -
 55
55 -
 56
56 -
 57
57 -
 58
58 -
 59
59 -
 60
60 -
 61
61 -
 62
62 -
 63
63 -
 64
64 -
 65
65 -
 66
66 -
 67
67 -
 68
68 -
 69
69 -
 70
70 -
 71
71 -
72
-
73
-
74
-
75
-
76
-
77
-
78
-
79
-
80
-
81
-
82
-
83
-
84
-
85
-
86
-
87
-
88
-
89
-
90
-
91
-
92
-
93
-
94
-
95
-
96
-
97
-
98
-
99
-
100
-
101
-
102
-
103
-
104
-
105
-
106
-
107
-
108
-
109
-
110
-
111
-
112
-
113
-
114
-
115
-
116
-
117
-
118
-
119
-
120
-
121
-
122
-
123
-
124
-
125
-
126
-
127
-
128
-
129
-
130
-
131
-
132
-
133
-
134
-
135
-
136
-
137
-
138
-
139
-
140
-
141
-
142
-
143
-
144
-
145
-
146
-
147
-
148
-
149
-
150
-
151
-
152
-
153
-
154
-
155
-
156
-
157
-
158
-
159
-
160
-
161
-
162
-
163
-
164
-
165
-
166
-
167
-
168
-
169
-
170
-
171
-
172
-
173
-
174
-
175
-
176
-
177
-
178
-
179
-
180
-
181
-
182
-
183
-
184
-
185
-
186
-
187
-
188
-
189
-
190
-
191
-
192
-
193
-
194
-
195
-
196
-
197
-
198
-
199
-
200
-
201
-
202
-
203
-
204
-
205
-
206
-
207
-
208
-
209
-
210
-
211
-
212
-
213
-
214
-
215
-
216
-
217
-
218
-
219
-
220
-
221
-
222
-
223
-
224
-
225
-
226
-
227
-
228
-
229
-
230
-
231
-
232
-
233
-
234
-
235
-
236
-
237
-
238
-
239
-
240
-
241
-
242
-
243
-
244
-
245
-
246
-
247
-
248
-
249
-
250
-
251
-
252
-
253
-
254
-
255
-
256
-
257
-
258
-
259
-
260
-
261
-
262
-
263
-
264
-
265
-
266
-
267
-
268
-
269
-
270
-
271
-
272
-
273
-
274
-
275
-
276
-
277
-
278
-
279
-
280
-
281
-
282
-
283
-
284
-
285
-
286
-
287
-
288
-
289
-
290
-
291
-
292
-
293
-
294
-
295
-
296
-
297
-
298
 |
 |

Item 7. Management’s Discussion and Analysis of Financial Condition and Results of Operations
(“MD&A”)
This MD&A should be read in conjunction with our audited consolidated financial statements as of
December 31, 2011 and related notes. This discussion contains forward-looking statements that are based upon
management’s current expectations and are subject to significant uncertainties and changes in circumstances.
Please review “Item 1. Business—Forward-Looking Statements” for more information on the forward-looking
statements in this report. Our actual results may differ materially from those included in these forward-looking
statements due to a variety of factors including, but not limited to, those described in this report in “Item 1A.
Risk Factors.”
INTRODUCTION
We are a diversified financial services holding company with banking and non-banking subsidiaries that offer a
broad array of financial products and services to consumers, small businesses and commercial clients through
branches, the internet and other distribution channels. We continue to deliver on our strategy of combining the
power of national scale lending and local scale banking.
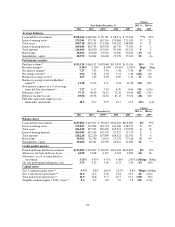
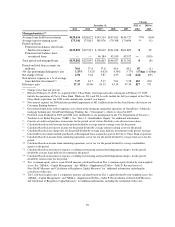
We had $135.9 billion in total loans outstanding and $128.2 billion in deposits as of December 31, 2011,
compared with $125.9 billion in total loans outstanding and $122.2 billion in deposits as of December 31, 2010.
Our revenues are primarily driven by lending to consumers and commercial customers and by deposit-taking
activities, which generate net interest income, and by activities that generate non-interest income, such as
fee-based services provided to customers, merchant interchange fees with respect to certain credit card
transactions, gains and losses and fees associated with the sale and servicing of loans. Our expenses primarily
consist of the cost of funding our assets, our provision for loan and lease losses, operating expenses (including
associate salaries and benefits, infrastructure maintenance and enhancements and branch operations and
expansion costs), marketing expenses and income taxes. We expect expenses associated with the integration of
the ING Direct and the pending acquisition of the HSBC U.S. credit card business to represent a significant
portion of our expenses in 2012.
Our principal operations are currently organized, for management reporting purposes, into three primary business
segments, which are defined based on the products and services provided or the type of customer served: Credit
Card, Consumer Banking and Commercial Banking. The operations of acquired businesses have been integrated
into our existing business segments. Certain activities that are not part of a segment are included in our “Other”
category.
•Credit Card: Consists of our domestic consumer and small business card lending, national small business
lending, national closed end installment lending and the international card lending businesses in Canada and
the United Kingdom.
•Consumer Banking: Consists of our branch-based lending and deposit gathering activities for consumers and
small businesses, national deposit gathering, national auto lending and consumer home loan lending and
servicing activities.
•Commercial Banking: Consists of our lending, deposit gathering and treasury management services to
commercial real estate and middle market customers. Our middle market customers typically include
commercial and industrial companies with annual revenues between $10 million to $1.0 billion.
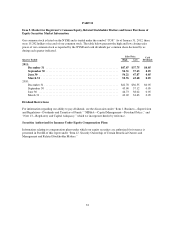
Table 1 summarizes our business segment results, which we report based on income from continuing operations,
net of tax, for 2011, 2010 and 2009. We provide a reconciliation of our total business segment results to our
consolidated results using U.S. GAAP in “Note 20—Business Segments” of this Report.
41