Capital One 2011 Annual Report Download - page 75
Download and view the complete annual report
Please find page 75 of the 2011 Capital One annual report below. You can navigate through the pages in the report by either clicking on the pages listed below, or by using the keyword search tool below to find specific information within the annual report.-
 1
1 -
2
-
3
-
4
-
5
-
6
-
7
-
8
-
9
-
10
-
11
-
12
-
13
-
14
-
15
-
16
-
17
-
18
-
19
-
20
-
21
-
22
-
23
-
24
-
25
-
26
-
27
-
28
-
29
-
30
-
31
-
32
-
33
-
34
-
35
-
36
-
37
-
38
-
39
-
40
-
41
-
42
-
43
-
44
-
45
-
46
-
47
-
48
-
49
-
50
-
51
-
52
-
53
-
54
-
55
-
56
-
57
-
58
-
59
-
60
-
61
-
62
-
63
-
64
-
 65
65 -
 66
66 -
 67
67 -
 68
68 -
 69
69 -
 70
70 -
 71
71 -
 72
72 -
 73
73 -
 74
74 -
 75
75 -
 76
76 -
 77
77 -
 78
78 -
 79
79 -
 80
80 -
 81
81 -
 82
82 -
 83
83 -
 84
84 -
 85
85 -
86
-
87
-
88
-
89
-
90
-
91
-
92
-
93
-
94
-
95
-
96
-
97
-
98
-
99
-
100
-
101
-
102
-
103
-
104
-
105
-
106
-
107
-
108
-
109
-
110
-
111
-
112
-
113
-
114
-
115
-
116
-
117
-
118
-
119
-
120
-
121
-
122
-
123
-
124
-
125
-
126
-
127
-
128
-
129
-
130
-
131
-
132
-
133
-
134
-
135
-
136
-
137
-
138
-
139
-
140
-
141
-
142
-
143
-
144
-
145
-
146
-
147
-
148
-
149
-
150
-
151
-
152
-
153
-
154
-
155
-
156
-
157
-
158
-
159
-
160
-
161
-
162
-
163
-
164
-
165
-
166
-
167
-
168
-
169
-
170
-
171
-
172
-
173
-
174
-
175
-
176
-
177
-
178
-
179
-
180
-
181
-
182
-
183
-
184
-
185
-
186
-
187
-
188
-
189
-
190
-
191
-
192
-
193
-
194
-
195
-
196
-
197
-
198
-
199
-
200
-
201
-
202
-
203
-
204
-
205
-
206
-
207
-
208
-
209
-
210
-
211
-
212
-
213
-
214
-
215
-
216
-
217
-
218
-
219
-
220
-
221
-
222
-
223
-
224
-
225
-
226
-
227
-
228
-
229
-
230
-
231
-
232
-
233
-
234
-
235
-
236
-
237
-
238
-
239
-
240
-
241
-
242
-
243
-
244
-
245
-
246
-
247
-
248
-
249
-
250
-
251
-
252
-
253
-
254
-
255
-
256
-
257
-
258
-
259
-
260
-
261
-
262
-
263
-
264
-
265
-
266
-
267
-
268
-
269
-
270
-
271
-
272
-
273
-
274
-
275
-
276
-
277
-
278
-
279
-
280
-
281
-
282
-
283
-
284
-
285
-
286
-
287
-
288
-
289
-
290
-
291
-
292
-
293
-
294
-
295
-
296
-
297
-
298
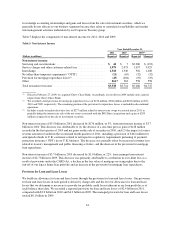
 |
 |
the same manner as the earnings on loans that we owned. Accordingly, the section below provides a comparative
discussion between our reported results of operations for 2011 and 2010 and between our reported results of
operations for 2010 and our managed results for 2009. Our net income on a managed basis for 2009 is the same
as our reported net income; however, there are differences in the classification of certain amounts in our managed
income statement, which we identify in our discussion. See “MD&A-Supplemental Tables” for a reconciliation
of our non-GAAP managed based information for periods prior to January 1, 2010 to the most comparable
reported U.S. GAAP information.
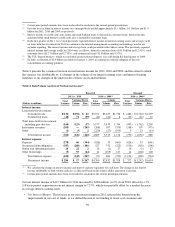
Net Interest Income
Net interest income represents the difference between the interest income and applicable fees earned on our
interest-earning assets, which include loans held for investment and investment securities, and the interest
expense on our interest-bearing liabilities, which include interest-bearing deposits, senior and subordinated notes,
securitized debt and other borrowings. We include in interest income any past due fees on loans that we deem are
collectible. Our net interest margin represents the difference between the yield on our interest-earning assets and
the cost of our interest-bearing liabilities, including the impact of non-interest bearing funding. Prior to the
adoption of the new consolidation accounting standards on January 1, 2010, our reported net interest income did
not include interest income from loans in our off-balance sheet securitization trusts or the interest expense on
third-party debt issued by these securitization trusts. Beginning January 1, 2010, servicing fees, finance charges,
other fees, net charge-offs and interest paid to third party investors related to consolidated securitization trusts are
included in net interest income. We expect net interest income and our net interest margin to fluctuate based on
changes in interest rates and changes in the amount and composition of our interest-earning assets and interest-
bearing liabilities.
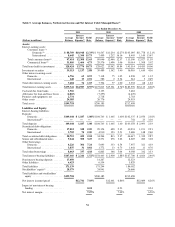
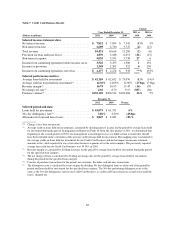
Table 2 below presents, for each major category of our interest-earning assets and interest-bearing liabilities, the
average outstanding balances, interest income earned or interest expense incurred, and average yield or cost in
2011, 2010 and 2009 based on our reported results. Table 3 presents this information based on our managed
results, which are the same as our reported results for 2011 and 2010.
55