Capital One 2011 Annual Report Download - page 65
Download and view the complete annual report
Please find page 65 of the 2011 Capital One annual report below. You can navigate through the pages in the report by either clicking on the pages listed below, or by using the keyword search tool below to find specific information within the annual report.-
 1
1 -
2
-
3
-
4
-
5
-
6
-
7
-
8
-
9
-
10
-
11
-
12
-
13
-
14
-
15
-
16
-
17
-
18
-
19
-
20
-
21
-
22
-
23
-
24
-
25
-
26
-
27
-
28
-
29
-
30
-
31
-
32
-
33
-
34
-
35
-
36
-
37
-
38
-
39
-
40
-
41
-
42
-
43
-
44
-
45
-
46
-
47
-
48
-
49
-
50
-
51
-
52
-
53
-
54
-
 55
55 -
 56
56 -
 57
57 -
 58
58 -
 59
59 -
 60
60 -
 61
61 -
 62
62 -
 63
63 -
 64
64 -
 65
65 -
 66
66 -
 67
67 -
 68
68 -
 69
69 -
 70
70 -
 71
71 -
 72
72 -
 73
73 -
 74
74 -
 75
75 -
76
-
77
-
78
-
79
-
80
-
81
-
82
-
83
-
84
-
85
-
86
-
87
-
88
-
89
-
90
-
91
-
92
-
93
-
94
-
95
-
96
-
97
-
98
-
99
-
100
-
101
-
102
-
103
-
104
-
105
-
106
-
107
-
108
-
109
-
110
-
111
-
112
-
113
-
114
-
115
-
116
-
117
-
118
-
119
-
120
-
121
-
122
-
123
-
124
-
125
-
126
-
127
-
128
-
129
-
130
-
131
-
132
-
133
-
134
-
135
-
136
-
137
-
138
-
139
-
140
-
141
-
142
-
143
-
144
-
145
-
146
-
147
-
148
-
149
-
150
-
151
-
152
-
153
-
154
-
155
-
156
-
157
-
158
-
159
-
160
-
161
-
162
-
163
-
164
-
165
-
166
-
167
-
168
-
169
-
170
-
171
-
172
-
173
-
174
-
175
-
176
-
177
-
178
-
179
-
180
-
181
-
182
-
183
-
184
-
185
-
186
-
187
-
188
-
189
-
190
-
191
-
192
-
193
-
194
-
195
-
196
-
197
-
198
-
199
-
200
-
201
-
202
-
203
-
204
-
205
-
206
-
207
-
208
-
209
-
210
-
211
-
212
-
213
-
214
-
215
-
216
-
217
-
218
-
219
-
220
-
221
-
222
-
223
-
224
-
225
-
226
-
227
-
228
-
229
-
230
-
231
-
232
-
233
-
234
-
235
-
236
-
237
-
238
-
239
-
240
-
241
-
242
-
243
-
244
-
245
-
246
-
247
-
248
-
249
-
250
-
251
-
252
-
253
-
254
-
255
-
256
-
257
-
258
-
259
-
260
-
261
-
262
-
263
-
264
-
265
-
266
-
267
-
268
-
269
-
270
-
271
-
272
-
273
-
274
-
275
-
276
-
277
-
278
-
279
-
280
-
281
-
282
-
283
-
284
-
285
-
286
-
287
-
288
-
289
-
290
-
291
-
292
-
293
-
294
-
295
-
296
-
297
-
298
 |
 |
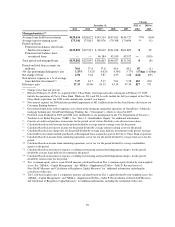
the credit card loan portfolios of Sony, HBC and Kohl’s and increased marketing expenditures. New
account originations have continued to grow in our Credit Card business, due in part to these acquisitions.
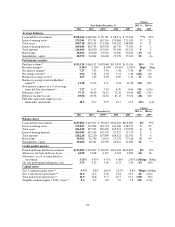
•Consumer Banking: Our Consumer Banking business generated net income from continuing operations of
$809 million in 2011, compared with net income from continuing operations of $905 million in 2010. The
decrease in net income for 2011 reflected the impact of the absence of a one-time pre-tax gain of $128
million recorded in the first quarter of 2010 from the deconsolidation of certain option-adjustable rate
mortgage trusts and an increase in the provision for loan and lease losses primarily attributable to growth in
auto loans. These factors were partially offset by an increase in total revenue resulting from a shift in our
loan product mix toward higher priced auto loans, coupled with lower cost deposit growth through our retail
banking branches. Strong growth in auto loan originations during 2011 more than offset a continued run-off
in legacy home loans.
•Commercial Banking: Our Commercial Banking business generated net income from continuing operations
of $532 million in 2011, compared with net income from continuing operations of $160 million in 2010.
The improvement in results for our Commercial Banking business reflected an increase in revenues, a
modest decrease in non-interest expense and a decrease in the provision for loan and lease losses due to the
improvement in credit quality. As a result of the improvement in credit quality, we reduced the allowance
for loan and lease losses for our Commercial Banking business by $146 million during 2011 to $711 million
as of December 31, 2011. We continued to experience steady loan and deposit growth in our Commercial
Banking business.
Business Environment and Significant Recent Developments
Recent Business and Regulatory Developments
The challenging economic environment continued through 2011 due to concerns about the U.S. debt ceiling and
subsequent downgrade of the U.S. debt, the continued elevated U.S. unemployment rate and the European debt
crisis. These concerns resulted in increased economic uncertainty and market volatility. We believe actions we
took in underwriting and managing our business through the recession, including focusing on our most resilient
businesses, have continued to drive our strong credit performance. As a result, we believe our internal portfolio
credit metrics remain strong, and expect normal seasonality to re-emerge after a long period of cyclical
improvement in 2011. We provide more information on recent regulatory developments in “Supervision and
Regulation” in “Item 1. Business” of this Report.
Acquisition-Related Developments
ING Direct
We completed the acquisition of ING Direct on February 17, 2012. The aggregate consideration paid was
54,028,086 shares of common stock and approximately $6.3 billion in cash. The ING Direct acquisition consists
of assets, which include cash and cash equivalents, investment securities and loans with a total estimated fair
value of $92.2 billion as of December 31, 2011 and deposits of approximately $83.0 billion as of December 31,
2011.
Equity and Debt Offerings
On July 19, 2011, we closed a public offering of four different series of our senior notes, for total proceeds of
approximately $3.0 billion. The offering of senior notes included $250 million aggregate principal amount of our
Floating Rate Senior Notes due 2014, $750 million aggregate principal amount of our 2.125% Senior Notes due
2014, $750 million aggregate principal amount of our 3.150% Senior Notes due 2016 and $1.25 billion aggregate
principal amount of our 4.750% Senior Notes due 2021.
45