Capital One 2011 Annual Report Download - page 197
Download and view the complete annual report
Please find page 197 of the 2011 Capital One annual report below. You can navigate through the pages in the report by either clicking on the pages listed below, or by using the keyword search tool below to find specific information within the annual report.-
 1
1 -
2
-
3
-
4
-
5
-
6
-
7
-
8
-
9
-
10
-
11
-
12
-
13
-
14
-
15
-
16
-
17
-
18
-
19
-
20
-
21
-
22
-
23
-
24
-
25
-
26
-
27
-
28
-
29
-
30
-
31
-
32
-
33
-
34
-
35
-
36
-
37
-
38
-
39
-
40
-
41
-
42
-
43
-
44
-
45
-
46
-
47
-
48
-
49
-
50
-
51
-
52
-
53
-
54
-
55
-
56
-
57
-
58
-
59
-
60
-
61
-
62
-
63
-
64
-
65
-
66
-
67
-
68
-
69
-
70
-
71
-
72
-
73
-
74
-
75
-
76
-
77
-
78
-
79
-
80
-
81
-
82
-
83
-
84
-
85
-
86
-
87
-
88
-
89
-
90
-
91
-
92
-
93
-
94
-
95
-
96
-
97
-
98
-
99
-
100
-
101
-
102
-
103
-
104
-
105
-
106
-
107
-
108
-
109
-
110
-
111
-
112
-
113
-
114
-
115
-
116
-
117
-
118
-
119
-
120
-
121
-
122
-
123
-
124
-
125
-
126
-
127
-
128
-
129
-
130
-
131
-
132
-
133
-
134
-
135
-
136
-
137
-
138
-
139
-
140
-
141
-
142
-
143
-
144
-
145
-
146
-
147
-
148
-
149
-
150
-
151
-
152
-
153
-
154
-
155
-
156
-
157
-
158
-
159
-
160
-
161
-
162
-
163
-
164
-
165
-
166
-
167
-
168
-
169
-
170
-
171
-
172
-
173
-
174
-
175
-
176
-
177
-
178
-
179
-
180
-
181
-
182
-
183
-
184
-
185
-
186
-
 187
187 -
 188
188 -
 189
189 -
 190
190 -
 191
191 -
 192
192 -
 193
193 -
 194
194 -
 195
195 -
 196
196 -
 197
197 -
 198
198 -
 199
199 -
 200
200 -
 201
201 -
 202
202 -
 203
203 -
 204
204 -
 205
205 -
 206
206 -
 207
207 -
208
-
209
-
210
-
211
-
212
-
213
-
214
-
215
-
216
-
217
-
218
-
219
-
220
-
221
-
222
-
223
-
224
-
225
-
226
-
227
-
228
-
229
-
230
-
231
-
232
-
233
-
234
-
235
-
236
-
237
-
238
-
239
-
240
-
241
-
242
-
243
-
244
-
245
-
246
-
247
-
248
-
249
-
250
-
251
-
252
-
253
-
254
-
255
-
256
-
257
-
258
-
259
-
260
-
261
-
262
-
263
-
264
-
265
-
266
-
267
-
268
-
269
-
270
-
271
-
272
-
273
-
274
-
275
-
276
-
277
-
278
-
279
-
280
-
281
-
282
-
283
-
284
-
285
-
286
-
287
-
288
-
289
-
290
-
291
-
292
-
293
-
294
-
295
-
296
-
297
-
298
 |
 |

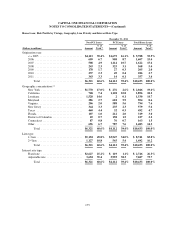
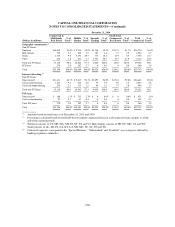
CAPITAL ONE FINANCIAL CORPORATION
NOTES TO CONSOLIDATED STATEMENTS—(Continued)
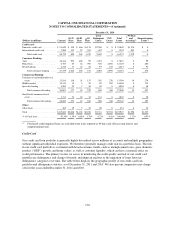
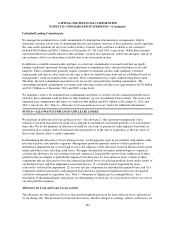
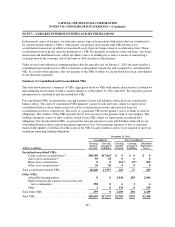
•Noncriticized: Loans that have not been designated as criticized, frequently referred to as “pass” loans.
•Criticized performing: Loans in which the financial condition of the obligor is stressed, affecting earnings,
cash flows or collateral values. The borrower currently has adequate capacity to meet near-term obligations;
however, the stress, left unabated, may result in deterioration of the repayment prospects at some future date.
•Criticized nonperforming: Loans that are not adequately protected by the current sound worth and paying
capacity of the obligor or the collateral pledged, if any. Loans classified as criticized nonperforming have a
well-defined weakness, or weaknesses, which jeopardize the repayment of the debt. These loans are
characterized by the distinct possibility that we will sustain a credit loss if the deficiencies are not corrected.
We use our internal risk-rating system for regulatory reporting, determining the frequency of review of the credit
exposures and evaluation and determination of the allowance for commercial loans. Loans of $1 million or more
designated as criticized performing and criticized nonperforming are reviewed quarterly by management for
further deterioration or improvement to determine if they are appropriately classified/graded and whether
impairment exists. All other loans greater than $1 million are specifically reviewed at least annually to determine
the appropriate loan grading. In addition, during the renewal process of any loan, as well if a loan becomes past
due, we evaluate the risk rating.
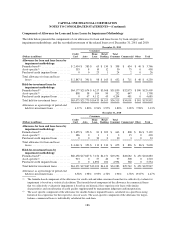
The following table presents the geographic distribution and internal risk ratings of our commercial loan
portfolio as of December 31, 2011 and 2010.
Commercial Banking: Risk Profile by Geographic Region and Internal Risk Rating(1)
December 31, 2011
(Dollars in millions)
Commercial &
Multifamily
Real Estate
% of
Total(2)
Middle
Market
% of
Total(2)
Specialty
Lending
% of
Total(2)
Small-ticket
Commercial
Real Estate
% of
Total(2)
Total
Commercial
% of
Total(2)
Geographic concentration:(3)
Non-PCI loans:
Northeast ................ $12,152 78.8% $ 3,650 28.8% $1,497 34.0% $ 907 60.3% $18,206 53.6%
Mid-Atlantic .............. 1,225 8.0 599 4.7 163 3.7 56 3.7 2,043 6.0
South ................... 1,581 10.3 7,527 59.3 797 18.1 93 6.2 9,998 29.4
Other ................... 289 1.9 590 4.7 1,947 44.2 447 29.8 3,273 9.6
Total non-PCI loans ........ 15,247 99.0 12,366 97.5 4,404 100.0 1,503 100.0 33,520 98.6
PCI loans ................ 163 1.0 318 2.5 0 0.0 0 0.0 481 1.4
Total .................... $15,410 100.0% $12,684 100.0% $4,404 100.0% $1,503 100.0% $34,001 100.0%
Internal risk rating:(4)
Non-PCI loans:
Noncriticized ............. $13,945 90.5% $11,680 92.1% $4,322 98.1% $1,359 90.4% $31,306 92.1%
Criticized performing ....... 1,096 7.1 593 4.7 49 1.1 105 7.0 1,843 5.4
Criticized nonperforming .... 206 1.4 93 0.7 33 0.8 39 2.6 371 1.1
Total non-PCI loans ........ 15,247 99.0 12,366 97.5 4,404 100.0 1,503 100.0 33,520 98.6
PCI loans:
Noncriticized ............. $ 127 0.8% $ 303 2.4% $ 0 0.0% $ 0 0.0% $ 430 1.3%
Criticized performing ....... 36 0.2 15 0.1 0 0.0 0 0.0 51 0.1
Total PCI loans ........... 163 1.0 318 2.5 0 0.0 0 0.0 481 1.4
Total .................... $15,410 100.0% $12,684 100.0% $4,404 100.0% $1,503 100.0% $34,001 100.0%
177