Capital One 2011 Annual Report Download - page 63
Download and view the complete annual report
Please find page 63 of the 2011 Capital One annual report below. You can navigate through the pages in the report by either clicking on the pages listed below, or by using the keyword search tool below to find specific information within the annual report.-
 1
1 -
2
-
3
-
4
-
5
-
6
-
7
-
8
-
9
-
10
-
11
-
12
-
13
-
14
-
15
-
16
-
17
-
18
-
19
-
20
-
21
-
22
-
23
-
24
-
25
-
26
-
27
-
28
-
29
-
30
-
31
-
32
-
33
-
34
-
35
-
36
-
37
-
38
-
39
-
40
-
41
-
42
-
43
-
44
-
45
-
46
-
47
-
48
-
49
-
50
-
51
-
52
-
 53
53 -
 54
54 -
 55
55 -
 56
56 -
 57
57 -
 58
58 -
 59
59 -
 60
60 -
 61
61 -
 62
62 -
 63
63 -
 64
64 -
 65
65 -
 66
66 -
 67
67 -
 68
68 -
 69
69 -
 70
70 -
 71
71 -
 72
72 -
 73
73 -
74
-
75
-
76
-
77
-
78
-
79
-
80
-
81
-
82
-
83
-
84
-
85
-
86
-
87
-
88
-
89
-
90
-
91
-
92
-
93
-
94
-
95
-
96
-
97
-
98
-
99
-
100
-
101
-
102
-
103
-
104
-
105
-
106
-
107
-
108
-
109
-
110
-
111
-
112
-
113
-
114
-
115
-
116
-
117
-
118
-
119
-
120
-
121
-
122
-
123
-
124
-
125
-
126
-
127
-
128
-
129
-
130
-
131
-
132
-
133
-
134
-
135
-
136
-
137
-
138
-
139
-
140
-
141
-
142
-
143
-
144
-
145
-
146
-
147
-
148
-
149
-
150
-
151
-
152
-
153
-
154
-
155
-
156
-
157
-
158
-
159
-
160
-
161
-
162
-
163
-
164
-
165
-
166
-
167
-
168
-
169
-
170
-
171
-
172
-
173
-
174
-
175
-
176
-
177
-
178
-
179
-
180
-
181
-
182
-
183
-
184
-
185
-
186
-
187
-
188
-
189
-
190
-
191
-
192
-
193
-
194
-
195
-
196
-
197
-
198
-
199
-
200
-
201
-
202
-
203
-
204
-
205
-
206
-
207
-
208
-
209
-
210
-
211
-
212
-
213
-
214
-
215
-
216
-
217
-
218
-
219
-
220
-
221
-
222
-
223
-
224
-
225
-
226
-
227
-
228
-
229
-
230
-
231
-
232
-
233
-
234
-
235
-
236
-
237
-
238
-
239
-
240
-
241
-
242
-
243
-
244
-
245
-
246
-
247
-
248
-
249
-
250
-
251
-
252
-
253
-
254
-
255
-
256
-
257
-
258
-
259
-
260
-
261
-
262
-
263
-
264
-
265
-
266
-
267
-
268
-
269
-
270
-
271
-
272
-
273
-
274
-
275
-
276
-
277
-
278
-
279
-
280
-
281
-
282
-
283
-
284
-
285
-
286
-
287
-
288
-
289
-
290
-
291
-
292
-
293
-
294
-
295
-
296
-
297
-
298
 |
 |

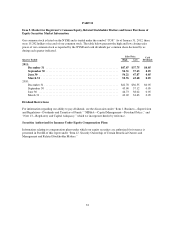
EXECUTIVE SUMMARY AND BUSINESS OUTLOOK
We continued to operate in an environment of elevated economic and regulatory uncertainty during 2011. The
overall economic recovery remained modest and fragile. The unemployment rate remained persistently high and
the housing market continued to struggle, due in part to the large backlog of homes in the foreclosure process and
high rate of delinquent loans. The ongoing and expected development of new regulations and regulatory
organizations resulting from the Dodd-Frank Act contributed to continued regulatory uncertainty. Despite the
challenges presented by these conditions, we experienced loan growth and stabilization in credit performance
during 2011.
Financial Highlights
We reported net income of $3.1 billion ($6.80 per diluted share) in 2011, with each of our three business
segments contributing to our earnings. In comparison, we reported net income of $2.7 billion ($6.01 per diluted
share) in 2010.
Our capital levels continued to increase during 2011, with total stockholders’ equity up $3.1 billion from
year-end 2010. Our Tier 1 risk-based capital ratio under Basel I was 12.0% as of December 31, 2011, up 40 basis
points from December 31, 2010, and our Tier 1 common equity ratio, a non-GAAP measure, was 9.7% as of
December 31, 2011, up 90 basis points from the prior year period, reflecting strong internal capital generation as
well as the continued decline in the amount of disallowed deferred tax assets. Our stockholders’ equity and
capital ratios as of December 31, 2011 do not reflect any impact from the equity forward sale agreements
executed in July 2011 referenced below, as they had not been settled in whole or in part as of that date. We
present the calculation of our regulatory capital ratios and a reconciliation of our supplemental non-GAAP
capital measures below under “MD&A—Supplemental Tables.”
In 2011, we acquired HBC’s existing $1.4 billion credit card loan portfolio and Kohl’s existing $3.7 billion
private-label credit card loan portfolio. In June 2011, we entered into a definitive agreement with the ING Sellers
to acquire ING Direct and closed the acquisition on February 17, 2012. In addition, in August 2011 we entered
into a purchase agreement with HSBC to acquire substantially all of the assets and assume liabilities of HSBC’s
credit card and private-label credit card business in the United States for an estimated cash premium of $2.6
billion as of June 30, 2011. We provide additional information on the ING Direct and HSBC acquisitions below.
We took several actions during the year to manage the anticipated impact of the ING Direct acquisition on our
market risk exposure and regulatory capital requirements. From the date we entered into the agreement to acquire
ING Direct to early August 2011, interest rates declined substantially, which resulted in an increase in the
estimated fair value of the ING Direct net assets and liabilities. In order to capture some of the anticipated
benefits to regulatory capital on the closing date attributable to this decline in interest rates, in early August 2011,
we entered into various interest-rate swap transactions with a total notional principal amount of approximately
$23.8 billion. We subsequently rebalanced the hedge in October 2011 adding an additional $1 billion in notional
principal for a total combined notional principal amount of approximately $24.8 billion. These combined swap
transactions were intended to mitigate the effect of a rise in interest rates on the fair values of a significant
portion of the ING Direct assets and liabilities during the period from when we entered into the swap transactions
to the anticipated closing date of the ING Direct acquisition in early 2012. Although the interest-rate swaps
represented economic hedges, they were not designated for hedge accounting under U.S. GAAP. Therefore, we
recorded changes in the fair value of these interest-rate swaps in earnings. In 2011, we recorded a
mark-to-market loss of $277 million related to these interest-rate swaps, which was attributable to the decline in
interest rates. This $277 million loss was largely offset by a gain of $259 million related to the sale of
approximately $9.2 billion of investment securities, consisting predominantly of agency mortgage-backed
securities (“MBS”). In conjunction with the acquisition of ING Direct on February 17, 2012, we terminated the
$24.8 billion in interest-rate swaps related to the acquisition. At termination, the fair value of the swaps was a net
loss of $355 million. Based on current estimates, we believe the interest-rate swaps related to the acquisition
were effective in meeting our hedging objective. For additional information, see “Market Risk Profile” and “Note
11—Derivative Instruments and Hedging Activities.”
43