Capital One 2011 Annual Report Download - page 228
Download and view the complete annual report
Please find page 228 of the 2011 Capital One annual report below. You can navigate through the pages in the report by either clicking on the pages listed below, or by using the keyword search tool below to find specific information within the annual report.-
 1
1 -
2
-
3
-
4
-
5
-
6
-
7
-
8
-
9
-
10
-
11
-
12
-
13
-
14
-
15
-
16
-
17
-
18
-
19
-
20
-
21
-
22
-
23
-
24
-
25
-
26
-
27
-
28
-
29
-
30
-
31
-
32
-
33
-
34
-
35
-
36
-
37
-
38
-
39
-
40
-
41
-
42
-
43
-
44
-
45
-
46
-
47
-
48
-
49
-
50
-
51
-
52
-
53
-
54
-
55
-
56
-
57
-
58
-
59
-
60
-
61
-
62
-
63
-
64
-
65
-
66
-
67
-
68
-
69
-
70
-
71
-
72
-
73
-
74
-
75
-
76
-
77
-
78
-
79
-
80
-
81
-
82
-
83
-
84
-
85
-
86
-
87
-
88
-
89
-
90
-
91
-
92
-
93
-
94
-
95
-
96
-
97
-
98
-
99
-
100
-
101
-
102
-
103
-
104
-
105
-
106
-
107
-
108
-
109
-
110
-
111
-
112
-
113
-
114
-
115
-
116
-
117
-
118
-
119
-
120
-
121
-
122
-
123
-
124
-
125
-
126
-
127
-
128
-
129
-
130
-
131
-
132
-
133
-
134
-
135
-
136
-
137
-
138
-
139
-
140
-
141
-
142
-
143
-
144
-
145
-
146
-
147
-
148
-
149
-
150
-
151
-
152
-
153
-
154
-
155
-
156
-
157
-
158
-
159
-
160
-
161
-
162
-
163
-
164
-
165
-
166
-
167
-
168
-
169
-
170
-
171
-
172
-
173
-
174
-
175
-
176
-
177
-
178
-
179
-
180
-
181
-
182
-
183
-
184
-
185
-
186
-
187
-
188
-
189
-
190
-
191
-
192
-
193
-
194
-
195
-
196
-
197
-
198
-
199
-
200
-
201
-
202
-
203
-
204
-
205
-
206
-
207
-
208
-
209
-
210
-
211
-
212
-
213
-
214
-
215
-
216
-
217
-
 218
218 -
 219
219 -
 220
220 -
 221
221 -
 222
222 -
 223
223 -
 224
224 -
 225
225 -
 226
226 -
 227
227 -
 228
228 -
 229
229 -
 230
230 -
 231
231 -
 232
232 -
 233
233 -
 234
234 -
 235
235 -
 236
236 -
 237
237 -
 238
238 -
239
-
240
-
241
-
242
-
243
-
244
-
245
-
246
-
247
-
248
-
249
-
250
-
251
-
252
-
253
-
254
-
255
-
256
-
257
-
258
-
259
-
260
-
261
-
262
-
263
-
264
-
265
-
266
-
267
-
268
-
269
-
270
-
271
-
272
-
273
-
274
-
275
-
276
-
277
-
278
-
279
-
280
-
281
-
282
-
283
-
284
-
285
-
286
-
287
-
288
-
289
-
290
-
291
-
292
-
293
-
294
-
295
-
296
-
297
-
298
 |
 |

CAPITAL ONE FINANCIAL CORPORATION
NOTES TO CONSOLIDATED STATEMENTS—(Continued)
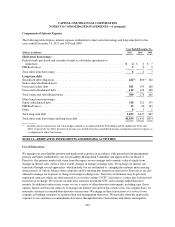
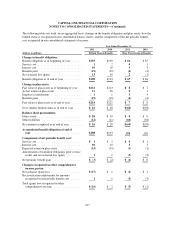
Year Ended December 31,
(Dollars in millions) 2011 2010 2009
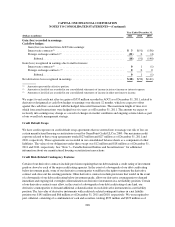
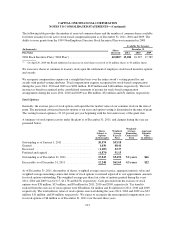
Gain (loss) recorded in earnings:
Cash flow hedges:
Gain (loss) reclassified from AOCI into earnings:
Interest rate contracts(2) ............................................... $3 $(51) (136)
Foreign exchange contracts(3) .......................................... (21) 0 (4)
Subtotal ........................................................ (18) (51) (140)
Gain (loss) recognized in earnings due to ineffectiveness:
Interest rate contracts(3) ............................................... 01 (1)
Foreign exchange contracts (3) .......................................... 000
Subtotal ........................................................ 01 (1)
Net derivatives loss recognized in earnings .................................... $(18) $(50) $(141)
(1) Amounts represent the effective portion.
(2) Amounts reclassified are recorded in our consolidated statements of income in interest income or interest expense.
(3) Amounts reclassified are recorded in our consolidated statements of income in other non-interest income.
We expect to reclassify net after-tax gains of $555 million recorded in AOCI as of December 31, 2011, related to
derivatives designated as cash flow hedges to earnings over the next 12 months, which we expect to offset
against the cash flows associated with the hedged forecasted transactions. The maximum length of time over
which forecasted transactions were hedged was six years as of December 31, 2011. The amount we expect to
reclassify into earnings may change as a result of changes in market conditions and ongoing actions taken as part
of our overall risk management strategy.
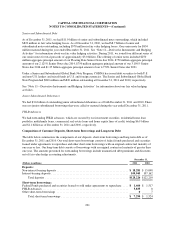
Credit Default Swaps
We have credit exposure on credit default swap agreements that we entered into to manage our risk of loss on
certain manufactured housing securitizations issued by GreenPoint Credit LLC in 2000. Our maximum credit
exposure related to these swap agreements totaled $23 million and $27 million as of December 31, 2011 and
2010, respectively. These agreements are recorded in our consolidated balance sheets as a component of other
liabilities. The value of our obligations under these swaps was $12 million and $18 million as of December 31,
2011 and 2010, respectively. See “Note 7—Variable Interest Entities and Securitizations” for additional
information about our manufactured housing securitization transactions.
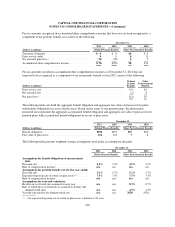
Credit Risk-Related Contingency Features
Certain of our derivative contracts include provisions requiring that our debt maintain a credit rating of investment
grade or above by each of the major credit rating agencies. In the event of a downgrade of our debt credit rating
below investment grade, some of our derivative counterparties would have the right to terminate the derivative
contract and close-out the existing positions. Other derivative contracts include provisions that would, in the event
of a downgrade of our debt credit rating below investment grade, allow our derivative counterparties to demand
immediate and ongoing full overnight collateralization on derivative instruments in a net liability position. Certain
of our derivative contracts may allow, in the event of a downgrade of our debt credit rating of any kind, our
derivative counterparties to demand additional collateralization on such derivative instruments in a net liability
position. The fair value of derivative instruments with credit-risk-related contingent features in a net liability
position was $141 million and $66 million as of December 31, 2011 and 2010, respectively. We were required to
post collateral, consisting of a combination of cash and securities, totaling $353 million and $229 million as of
208