Capital One 2011 Annual Report Download - page 83
Download and view the complete annual report
Please find page 83 of the 2011 Capital One annual report below. You can navigate through the pages in the report by either clicking on the pages listed below, or by using the keyword search tool below to find specific information within the annual report.-
 1
1 -
2
-
3
-
4
-
5
-
6
-
7
-
8
-
9
-
10
-
11
-
12
-
13
-
14
-
15
-
16
-
17
-
18
-
19
-
20
-
21
-
22
-
23
-
24
-
25
-
26
-
27
-
28
-
29
-
30
-
31
-
32
-
33
-
34
-
35
-
36
-
37
-
38
-
39
-
40
-
41
-
42
-
43
-
44
-
45
-
46
-
47
-
48
-
49
-
50
-
51
-
52
-
53
-
54
-
55
-
56
-
57
-
58
-
59
-
60
-
61
-
62
-
63
-
64
-
65
-
66
-
67
-
68
-
69
-
70
-
71
-
72
-
 73
73 -
 74
74 -
 75
75 -
 76
76 -
 77
77 -
 78
78 -
 79
79 -
 80
80 -
 81
81 -
 82
82 -
 83
83 -
 84
84 -
 85
85 -
 86
86 -
 87
87 -
 88
88 -
 89
89 -
 90
90 -
 91
91 -
 92
92 -
 93
93 -
94
-
95
-
96
-
97
-
98
-
99
-
100
-
101
-
102
-
103
-
104
-
105
-
106
-
107
-
108
-
109
-
110
-
111
-
112
-
113
-
114
-
115
-
116
-
117
-
118
-
119
-
120
-
121
-
122
-
123
-
124
-
125
-
126
-
127
-
128
-
129
-
130
-
131
-
132
-
133
-
134
-
135
-
136
-
137
-
138
-
139
-
140
-
141
-
142
-
143
-
144
-
145
-
146
-
147
-
148
-
149
-
150
-
151
-
152
-
153
-
154
-
155
-
156
-
157
-
158
-
159
-
160
-
161
-
162
-
163
-
164
-
165
-
166
-
167
-
168
-
169
-
170
-
171
-
172
-
173
-
174
-
175
-
176
-
177
-
178
-
179
-
180
-
181
-
182
-
183
-
184
-
185
-
186
-
187
-
188
-
189
-
190
-
191
-
192
-
193
-
194
-
195
-
196
-
197
-
198
-
199
-
200
-
201
-
202
-
203
-
204
-
205
-
206
-
207
-
208
-
209
-
210
-
211
-
212
-
213
-
214
-
215
-
216
-
217
-
218
-
219
-
220
-
221
-
222
-
223
-
224
-
225
-
226
-
227
-
228
-
229
-
230
-
231
-
232
-
233
-
234
-
235
-
236
-
237
-
238
-
239
-
240
-
241
-
242
-
243
-
244
-
245
-
246
-
247
-
248
-
249
-
250
-
251
-
252
-
253
-
254
-
255
-
256
-
257
-
258
-
259
-
260
-
261
-
262
-
263
-
264
-
265
-
266
-
267
-
268
-
269
-
270
-
271
-
272
-
273
-
274
-
275
-
276
-
277
-
278
-
279
-
280
-
281
-
282
-
283
-
284
-
285
-
286
-
287
-
288
-
289
-
290
-
291
-
292
-
293
-
294
-
295
-
296
-
297
-
298
 |
 |

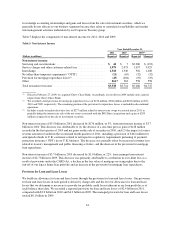
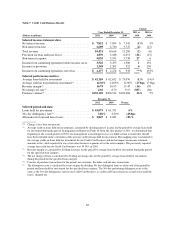
The decrease in our effective income tax rate in 2011 from 2010 reflected an increase in the amount of one-time
tax benefits recorded over the prior year. During 2011, we recorded discrete tax benefits of $121 million related
primarily to the release of valuation allowances against certain state deferred tax assets and net operating loss
carryforwards and the resolution of certain tax issues and audits. In comparison, in 2010 we recorded discrete tax
benefits of $84 million related primarily to adjustments for the resolution of certain tax issues and audits. Our
effective income tax rate excluding the benefit from these discrete tax items was 31.7% and 31.5% for 2011 and
2010.
The increase in our effective income tax rate in 2010 from 2009 reflected the reduced relative benefit of
tax-exempt income and tax credits as a result of the increase in our pre-tax earnings. The $84 million of discrete
tax benefits in 2010 related to the resolution of certain tax issues and audits partially offset the increase in the
2010 effective tax rate compared to 2009.
We provide additional information on items affecting our income taxes and effective tax rate in “Note 18—
Income Taxes.”
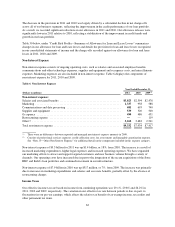
Loss from Discontinued Operations, Net of Tax
Loss from discontinued operations reflects ongoing costs, which primarily consist of mortgage loan repurchase
representation and warranty charges, related to the mortgage origination operations of GreenPoint’s wholesale
mortgage banking unit, which we closed in 2007. We recorded a loss from discontinued operations, net of tax, of
$106 million, $307 million and $103 million in 2011, 2010 and 2009, respectively. The variance in the loss from
discontinued operations between 2011 and 2010 and between 2010 and 2009 is attributable to the provision for
mortgage repurchase losses. We recorded a total pre-tax provision for mortgage repurchase losses of $212
million, $636 million and $181 million in 2011, 2010 and 2009, respectively. The portion of these amounts
included in loss from discontinued operations totaled $169 million ($120 million net of tax) in 2011, $432
million ($304 million net of tax) in 2010 and $162 million ($120 million net of tax) in 2009.
We provide additional information on the provision for mortgage repurchase losses and the related reserve for
potential representation and warranty claims in “Critical Accounting Polices and Estimates” and in
“Consolidated Balance Sheet Analysis—Potential Mortgage Representation and Warranty Liabilities.”
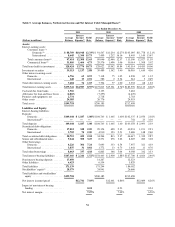
BUSINESS SEGMENT FINANCIAL PERFORMANCE
Our principal operations are currently organized into three major business segments, which are defined based on
the products and services provided, or the type of customer served: Credit Card, Consumer Banking and
Commercial Banking. The operations of acquired businesses have been integrated into our existing business
segments. Certain activities that are not part of a segment, such as management of our corporate investment
portfolio and asset/liability management by our centralized Corporate Treasury group are included in the “Other”
category. See “Note 20—Business Segments” for information on the allocation methodologies used to derive our
business segment results.
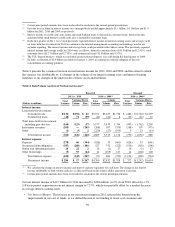
The results of our individual businesses, which we report on a continuing operations basis, reflect the manner in
which management evaluates performance and makes decisions about funding our operations and allocating
resources. Our business segment results are intended to reflect each segment as if it were a stand-alone business.
We use an internal management and reporting process to derive our business segment results. Our internal
management and reporting process employs various allocation methodologies, including funds transfer pricing,
to assign certain managed balance sheet assets, deposits and other liabilities and their related revenue and
expenses directly or indirectly attributable to each business segment.
We refer to the business segment results derived from our internal management accounting and reporting process
as our “managed” presentation, which differs in some cases from our reported results prepared based on
63