Capital One 2011 Annual Report Download - page 94
Download and view the complete annual report
Please find page 94 of the 2011 Capital One annual report below. You can navigate through the pages in the report by either clicking on the pages listed below, or by using the keyword search tool below to find specific information within the annual report.-
 1
1 -
2
-
3
-
4
-
5
-
6
-
7
-
8
-
9
-
10
-
11
-
12
-
13
-
14
-
15
-
16
-
17
-
18
-
19
-
20
-
21
-
22
-
23
-
24
-
25
-
26
-
27
-
28
-
29
-
30
-
31
-
32
-
33
-
34
-
35
-
36
-
37
-
38
-
39
-
40
-
41
-
42
-
43
-
44
-
45
-
46
-
47
-
48
-
49
-
50
-
51
-
52
-
53
-
54
-
55
-
56
-
57
-
58
-
59
-
60
-
61
-
62
-
63
-
64
-
65
-
66
-
67
-
68
-
69
-
70
-
71
-
72
-
73
-
74
-
75
-
76
-
77
-
78
-
79
-
80
-
81
-
82
-
83
-
 84
84 -
 85
85 -
 86
86 -
 87
87 -
 88
88 -
 89
89 -
 90
90 -
 91
91 -
 92
92 -
 93
93 -
 94
94 -
 95
95 -
 96
96 -
 97
97 -
 98
98 -
 99
99 -
 100
100 -
 101
101 -
 102
102 -
 103
103 -
 104
104 -
105
-
106
-
107
-
108
-
109
-
110
-
111
-
112
-
113
-
114
-
115
-
116
-
117
-
118
-
119
-
120
-
121
-
122
-
123
-
124
-
125
-
126
-
127
-
128
-
129
-
130
-
131
-
132
-
133
-
134
-
135
-
136
-
137
-
138
-
139
-
140
-
141
-
142
-
143
-
144
-
145
-
146
-
147
-
148
-
149
-
150
-
151
-
152
-
153
-
154
-
155
-
156
-
157
-
158
-
159
-
160
-
161
-
162
-
163
-
164
-
165
-
166
-
167
-
168
-
169
-
170
-
171
-
172
-
173
-
174
-
175
-
176
-
177
-
178
-
179
-
180
-
181
-
182
-
183
-
184
-
185
-
186
-
187
-
188
-
189
-
190
-
191
-
192
-
193
-
194
-
195
-
196
-
197
-
198
-
199
-
200
-
201
-
202
-
203
-
204
-
205
-
206
-
207
-
208
-
209
-
210
-
211
-
212
-
213
-
214
-
215
-
216
-
217
-
218
-
219
-
220
-
221
-
222
-
223
-
224
-
225
-
226
-
227
-
228
-
229
-
230
-
231
-
232
-
233
-
234
-
235
-
236
-
237
-
238
-
239
-
240
-
241
-
242
-
243
-
244
-
245
-
246
-
247
-
248
-
249
-
250
-
251
-
252
-
253
-
254
-
255
-
256
-
257
-
258
-
259
-
260
-
261
-
262
-
263
-
264
-
265
-
266
-
267
-
268
-
269
-
270
-
271
-
272
-
273
-
274
-
275
-
276
-
277
-
278
-
279
-
280
-
281
-
282
-
283
-
284
-
285
-
286
-
287
-
288
-
289
-
290
-
291
-
292
-
293
-
294
-
295
-
296
-
297
-
298
 |
 |

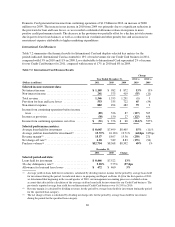
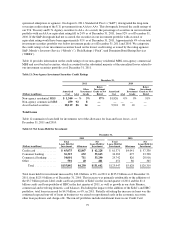
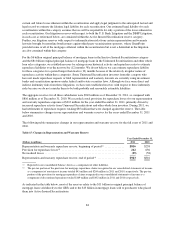
net interest income from loans and non-interest income from customer fees. Expenses primarily consist of
ongoing operating costs, such as salaries and associated benefits, communications and other technology
expenses, supplies and equipment and occupancy costs.
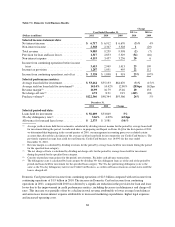
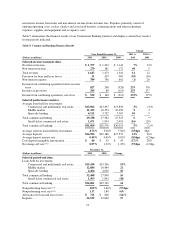
Table 9 summarizes the financial results of our Commercial Banking business and displays selected key metrics
for the periods indicated.
Table 9: Commercial Banking Business Results
Change
Year Ended December 31, 2011 vs. 2010 vs.
(Dollars in millions) 2011 2010 2009 2010 2009
Selected income statement data:
Net interest income ......................... $ 1,377 $ 1,292 $ 1,144 7% 13%
Non-interest income ........................ 270 181 172 49 5
Total revenue .............................. 1,647 1,473 1,316 12 12
Provision for loan and lease losses ............. 31 429 983 (93) (56)
Non-interest expense ........................ 789 796 661 (1) 20
Income from continuing operations before income
taxes ................................... 827 248 (328) 233 176
Income tax provision ........................ 295 88 (115) 235 177
Income from continuing operations, net of tax .... $ 532 $ 160 $ (213) 233% 175%
Selected performance metrics:
Average loans held for investment:
Commercial and multifamily real estate ..... $13,902 $13,497 $13,858 3% (3)%
Middle market ......................... 11,325 10,353 10,098 93
Specialty lending ....................... 4,111 3,732 3,567 10 5
Total commercial lending .................... 29,338 27,582 27,523 6**
Small-ticket commercial real estate ........ 1,671 1,994 2,491 (16) (20)
Total commercial banking .................... $31,009 $29,576 $30,014 5% (1)%
Average yield on loans held for investment ...... 4.73% 5.06% 5.02% (33)bps 4bps
Average deposits ........................... $24,926 $22,186 $17,572 12% 26%
Average deposit interest rate .................. 0.49% 0.69% 0.81% (20)bps (12)bps
Core deposit intangible amortization ........... $40$55$43 (27)% 28%
Net charge-off rate(1)(2) ...................... 0.57% 1.32% 1.45% (75)bps (13)bps
December 31,
(Dollars in millions) 2011 2010 Change
Selected period-end data:
Loans held for investment:
Commercial and multifamily real estate ..... $15,410 $13,396 15%
Middle market ......................... 12,684 10,484 21
Specialty lending ....................... 4,404 4,020 10
Total commercial lending .................... 32,498 27,900 16
Small-ticket commercial real estate ........ 1,503 1,842 (18)
Total commercial banking .................... $34,001 $29,742 14
Nonperforming loan rate(1)(3) .................. 1.09% 1.66% (57)bps
Nonperforming asset rate(1)(4) ................. 1.17 1.80 (63)
Allowance for loan and lease losses ............ $ 711 $ 826 (14)%
Deposits .................................. 26,532 22,630 17
74