Capital One 2011 Annual Report Download - page 183
Download and view the complete annual report
Please find page 183 of the 2011 Capital One annual report below. You can navigate through the pages in the report by either clicking on the pages listed below, or by using the keyword search tool below to find specific information within the annual report.-
 1
1 -
2
-
3
-
4
-
5
-
6
-
7
-
8
-
9
-
10
-
11
-
12
-
13
-
14
-
15
-
16
-
17
-
18
-
19
-
20
-
21
-
22
-
23
-
24
-
25
-
26
-
27
-
28
-
29
-
30
-
31
-
32
-
33
-
34
-
35
-
36
-
37
-
38
-
39
-
40
-
41
-
42
-
43
-
44
-
45
-
46
-
47
-
48
-
49
-
50
-
51
-
52
-
53
-
54
-
55
-
56
-
57
-
58
-
59
-
60
-
61
-
62
-
63
-
64
-
65
-
66
-
67
-
68
-
69
-
70
-
71
-
72
-
73
-
74
-
75
-
76
-
77
-
78
-
79
-
80
-
81
-
82
-
83
-
84
-
85
-
86
-
87
-
88
-
89
-
90
-
91
-
92
-
93
-
94
-
95
-
96
-
97
-
98
-
99
-
100
-
101
-
102
-
103
-
104
-
105
-
106
-
107
-
108
-
109
-
110
-
111
-
112
-
113
-
114
-
115
-
116
-
117
-
118
-
119
-
120
-
121
-
122
-
123
-
124
-
125
-
126
-
127
-
128
-
129
-
130
-
131
-
132
-
133
-
134
-
135
-
136
-
137
-
138
-
139
-
140
-
141
-
142
-
143
-
144
-
145
-
146
-
147
-
148
-
149
-
150
-
151
-
152
-
153
-
154
-
155
-
156
-
157
-
158
-
159
-
160
-
161
-
162
-
163
-
164
-
165
-
166
-
167
-
168
-
169
-
170
-
171
-
172
-
 173
173 -
 174
174 -
 175
175 -
 176
176 -
 177
177 -
 178
178 -
 179
179 -
 180
180 -
 181
181 -
 182
182 -
 183
183 -
 184
184 -
 185
185 -
 186
186 -
 187
187 -
 188
188 -
 189
189 -
 190
190 -
 191
191 -
 192
192 -
 193
193 -
194
-
195
-
196
-
197
-
198
-
199
-
200
-
201
-
202
-
203
-
204
-
205
-
206
-
207
-
208
-
209
-
210
-
211
-
212
-
213
-
214
-
215
-
216
-
217
-
218
-
219
-
220
-
221
-
222
-
223
-
224
-
225
-
226
-
227
-
228
-
229
-
230
-
231
-
232
-
233
-
234
-
235
-
236
-
237
-
238
-
239
-
240
-
241
-
242
-
243
-
244
-
245
-
246
-
247
-
248
-
249
-
250
-
251
-
252
-
253
-
254
-
255
-
256
-
257
-
258
-
259
-
260
-
261
-
262
-
263
-
264
-
265
-
266
-
267
-
268
-
269
-
270
-
271
-
272
-
273
-
274
-
275
-
276
-
277
-
278
-
279
-
280
-
281
-
282
-
283
-
284
-
285
-
286
-
287
-
288
-
289
-
290
-
291
-
292
-
293
-
294
-
295
-
296
-
297
-
298
 |
 |

CAPITAL ONE FINANCIAL CORPORATION
NOTES TO CONSOLIDATED STATEMENTS—(Continued)
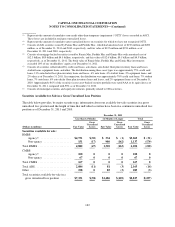
December 31, 2010
Less than 12 Months 12 Months or Longer Total
(Dollars in millions) Fair Value
Gross
Unrealized
Losses Fair Value
Gross
Unrealized
Losses Fair Value
Gross
Unrealized
Losses
Securities available for sale:
RMBS:
Agency(1) ....................... $6,571 $(141) $ 456 $ (2) $ 7,027 $(143)
Non-agency ..................... 45 0 1,566 (127) 1,611 (127)
Total RMBS ........................ 6,616 (141) 2,022 (129) 8,638 (270)
Total ABS .......................... 1,411 (2) 33 (2) 1,444 (4)
Other .............................. 300 (1) 80 (6) 380 (7)
Total securities available-for-sale in a
gross unrealized loss position ......... $8,327 $(144) $2,135 $(137) $10,462 $(281)
(1) Consists of mortgage-backed securities issued by Fannie Mae, Freddie Mac and Ginnie Mae.
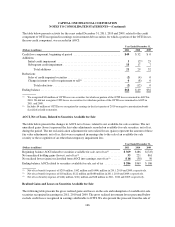
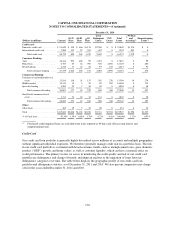
The gross unrealized losses on our available-for-sale securities of $227 million as of December 31, 2011 relate to
397 individual securities. Our investments in non-agency MBS and non-agency asset-backed securities accounted
for $193 million, or 85%, of total gross unrealized losses as of December 31, 2011. Of the $227 million gross
unrealized losses as of December 31, 2011, $169 million related to securities that had been in a loss position for
more than 12 months. As discussed in more detail below, we conduct periodic reviews of all securities with
unrealized losses to assess whether the impairment is other-than-temporary. Based on our assessments, we have
recorded OTTI for a portion of our non-agency residential MBS, which is discussed in more detail later in this
footnote.
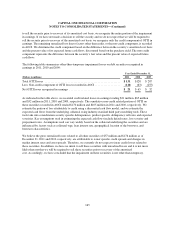
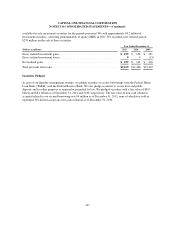
Maturities and Yields of Securities Available for Sale
The following table summarizes the remaining scheduled contractual maturities, assuming no prepayments, of
our investment securities as of December 31, 2011:
December 31, 2011
(Dollars in millions)
Amortized
Cost Fair Value
Due in 1 year or less ........................................................ $ 3,495 $ 3,508
Due after 1 year through 5 years .............................................. 6,708 6,750
Due after 5 years through 10 years ............................................ 1,764 1,810
Due after 10 years(1) ........................................................ 26,336 26,691
Total .................................................................... $38,303 $38,759
(1) Investments with no stated maturities, which consist of equity securities, are included with contractual maturities due
after 10 years.
163