Capital One 2011 Annual Report Download - page 190
Download and view the complete annual report
Please find page 190 of the 2011 Capital One annual report below. You can navigate through the pages in the report by either clicking on the pages listed below, or by using the keyword search tool below to find specific information within the annual report.-
 1
1 -
2
-
3
-
4
-
5
-
6
-
7
-
8
-
9
-
10
-
11
-
12
-
13
-
14
-
15
-
16
-
17
-
18
-
19
-
20
-
21
-
22
-
23
-
24
-
25
-
26
-
27
-
28
-
29
-
30
-
31
-
32
-
33
-
34
-
35
-
36
-
37
-
38
-
39
-
40
-
41
-
42
-
43
-
44
-
45
-
46
-
47
-
48
-
49
-
50
-
51
-
52
-
53
-
54
-
55
-
56
-
57
-
58
-
59
-
60
-
61
-
62
-
63
-
64
-
65
-
66
-
67
-
68
-
69
-
70
-
71
-
72
-
73
-
74
-
75
-
76
-
77
-
78
-
79
-
80
-
81
-
82
-
83
-
84
-
85
-
86
-
87
-
88
-
89
-
90
-
91
-
92
-
93
-
94
-
95
-
96
-
97
-
98
-
99
-
100
-
101
-
102
-
103
-
104
-
105
-
106
-
107
-
108
-
109
-
110
-
111
-
112
-
113
-
114
-
115
-
116
-
117
-
118
-
119
-
120
-
121
-
122
-
123
-
124
-
125
-
126
-
127
-
128
-
129
-
130
-
131
-
132
-
133
-
134
-
135
-
136
-
137
-
138
-
139
-
140
-
141
-
142
-
143
-
144
-
145
-
146
-
147
-
148
-
149
-
150
-
151
-
152
-
153
-
154
-
155
-
156
-
157
-
158
-
159
-
160
-
161
-
162
-
163
-
164
-
165
-
166
-
167
-
168
-
169
-
170
-
171
-
172
-
173
-
174
-
175
-
176
-
177
-
178
-
179
-
 180
180 -
 181
181 -
 182
182 -
 183
183 -
 184
184 -
 185
185 -
 186
186 -
 187
187 -
 188
188 -
 189
189 -
 190
190 -
 191
191 -
 192
192 -
 193
193 -
 194
194 -
 195
195 -
 196
196 -
 197
197 -
 198
198 -
 199
199 -
 200
200 -
201
-
202
-
203
-
204
-
205
-
206
-
207
-
208
-
209
-
210
-
211
-
212
-
213
-
214
-
215
-
216
-
217
-
218
-
219
-
220
-
221
-
222
-
223
-
224
-
225
-
226
-
227
-
228
-
229
-
230
-
231
-
232
-
233
-
234
-
235
-
236
-
237
-
238
-
239
-
240
-
241
-
242
-
243
-
244
-
245
-
246
-
247
-
248
-
249
-
250
-
251
-
252
-
253
-
254
-
255
-
256
-
257
-
258
-
259
-
260
-
261
-
262
-
263
-
264
-
265
-
266
-
267
-
268
-
269
-
270
-
271
-
272
-
273
-
274
-
275
-
276
-
277
-
278
-
279
-
280
-
281
-
282
-
283
-
284
-
285
-
286
-
287
-
288
-
289
-
290
-
291
-
292
-
293
-
294
-
295
-
296
-
297
-
298
 |
 |

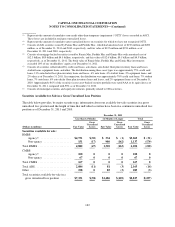
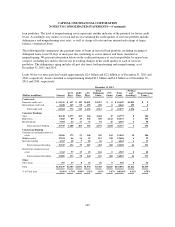
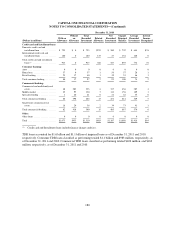
CAPITAL ONE FINANCIAL CORPORATION
NOTES TO CONSOLIDATED STATEMENTS—(Continued)
December 31, 2010
(Dollars in millions) Current
30-59
Days
60-89
Days
> 90
Days
Total
Delinquent
Loans
PCI
Loans
Total
Loans
> 90 Days
and
Accruing(1)
Nonperforming
Loans(1)
Credit card:
Domestic credit card ............ $ 51,649 $ 558 $ 466 $1,176 $2,200 $ 0 $ 53,849 $1,176 $ 0
International credit card .......... 7,090 132 97 203 432 0 7,522 203 0
Total credit card ............ 58,739 690 563 1,379 2,632 0 61,371 1,379 0
Consumer Banking:
Auto ......................... 16,414 952 402 99 1,453 0 17,867 0 99
Home loan .................... 6,707 65 44 395 504 4,892 12,103 0 486
Retail banking ................. 4,218 31 22 40 93 102 4,413 5 91
Total consumer banking ...... 27,339 1,048 468 534 2,050 4,994 34,383 5 676
Commercial Banking:
Commercial and multifamily real
estate ....................... 12,816 118 31 153 302 278 13,396 14 276
Middle market ................. 10,113 34 5 50 89 282 10,484 0 133
Specialty lending ............... 3,962 25 7 26 58 0 4,020 0 48
Total commercial lending .... 26,891 177 43 229 449 560 27,900 14 457
Small-ticket commercial real
estate ....................... 1,711 74 24 33 131 0 1,842 0 38
Total commercial banking .... 28,602 251 67 262 580 560 29,742 14 495
Other:
Other loans .................... 382 19 5 45 69 0 451 0 54
Total ......................... $115,062 $2,008 $1,103 $2,220 $5,331 $5,554 $125,947 $1,398 $1,225
% of Total loans ................ 91.36% 1.59% 0.88% 1.76% 4.23% 4.41% 100.00% 1.11% 0.97%
(1) Purchased credit-impaired loans are excluded from loans reported as 90 days and still accruing interest and
nonperforming loans.
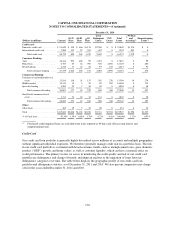
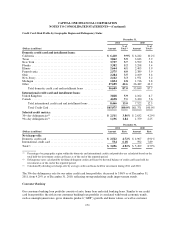
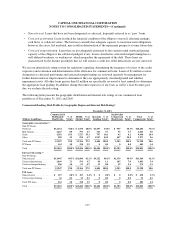
Credit Card
Our credit card loan portfolio is generally highly diversified across millions of accounts and multiple geographies
without significant individual exposures. We therefore generally manage credit risk on a portfolio basis. The risk
in our credit card portfolio is correlated with broad economic trends, such as unemployment rates, gross domestic
product (“GDP”) growth, and home values, as well as customer liquidity, which can have a material effect on
credit performance. The primary factors we assess in monitoring the credit quality and risk of our credit card
portfolio are delinquency and charge-off trends, including an analysis of the migration of loans between
delinquency categories over time. The table below displays the geographic profile of our credit card loan
portfolio and delinquency statistics as of December 31, 2011 and 2010. We also present comparative net-charge
offs for the years ended December 31, 2011 and 2010.
170