Capital One 2011 Annual Report Download - page 246
Download and view the complete annual report
Please find page 246 of the 2011 Capital One annual report below. You can navigate through the pages in the report by either clicking on the pages listed below, or by using the keyword search tool below to find specific information within the annual report.-
 1
1 -
2
-
3
-
4
-
5
-
6
-
7
-
8
-
9
-
10
-
11
-
12
-
13
-
14
-
15
-
16
-
17
-
18
-
19
-
20
-
21
-
22
-
23
-
24
-
25
-
26
-
27
-
28
-
29
-
30
-
31
-
32
-
33
-
34
-
35
-
36
-
37
-
38
-
39
-
40
-
41
-
42
-
43
-
44
-
45
-
46
-
47
-
48
-
49
-
50
-
51
-
52
-
53
-
54
-
55
-
56
-
57
-
58
-
59
-
60
-
61
-
62
-
63
-
64
-
65
-
66
-
67
-
68
-
69
-
70
-
71
-
72
-
73
-
74
-
75
-
76
-
77
-
78
-
79
-
80
-
81
-
82
-
83
-
84
-
85
-
86
-
87
-
88
-
89
-
90
-
91
-
92
-
93
-
94
-
95
-
96
-
97
-
98
-
99
-
100
-
101
-
102
-
103
-
104
-
105
-
106
-
107
-
108
-
109
-
110
-
111
-
112
-
113
-
114
-
115
-
116
-
117
-
118
-
119
-
120
-
121
-
122
-
123
-
124
-
125
-
126
-
127
-
128
-
129
-
130
-
131
-
132
-
133
-
134
-
135
-
136
-
137
-
138
-
139
-
140
-
141
-
142
-
143
-
144
-
145
-
146
-
147
-
148
-
149
-
150
-
151
-
152
-
153
-
154
-
155
-
156
-
157
-
158
-
159
-
160
-
161
-
162
-
163
-
164
-
165
-
166
-
167
-
168
-
169
-
170
-
171
-
172
-
173
-
174
-
175
-
176
-
177
-
178
-
179
-
180
-
181
-
182
-
183
-
184
-
185
-
186
-
187
-
188
-
189
-
190
-
191
-
192
-
193
-
194
-
195
-
196
-
197
-
198
-
199
-
200
-
201
-
202
-
203
-
204
-
205
-
206
-
207
-
208
-
209
-
210
-
211
-
212
-
213
-
214
-
215
-
216
-
217
-
218
-
219
-
220
-
221
-
222
-
223
-
224
-
225
-
226
-
227
-
228
-
229
-
230
-
231
-
232
-
233
-
234
-
235
-
 236
236 -
 237
237 -
 238
238 -
 239
239 -
 240
240 -
 241
241 -
 242
242 -
 243
243 -
 244
244 -
 245
245 -
 246
246 -
 247
247 -
 248
248 -
 249
249 -
 250
250 -
 251
251 -
 252
252 -
 253
253 -
 254
254 -
 255
255 -
 256
256 -
257
-
258
-
259
-
260
-
261
-
262
-
263
-
264
-
265
-
266
-
267
-
268
-
269
-
270
-
271
-
272
-
273
-
274
-
275
-
276
-
277
-
278
-
279
-
280
-
281
-
282
-
283
-
284
-
285
-
286
-
287
-
288
-
289
-
290
-
291
-
292
-
293
-
294
-
295
-
296
-
297
-
298
 |
 |

CAPITAL ONE FINANCIAL CORPORATION
NOTES TO CONSOLIDATED STATEMENTS—(Continued)
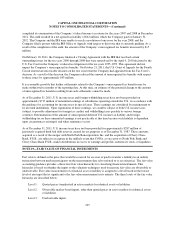
The accounting guidance for fair value requires that we maximize the use of observable inputs and minimize the
use of unobservable inputs in determining fair value. The accounting guidance for derivatives also provides for
the irrevocable option to elect, on a contract-by-contract basis, to measure certain financial assets and liabilities
at fair value at inception of the contract and record any subsequent changes in fair value into earnings. We had
not made any material fair value option elections as of December 31, 2011 and 2010.
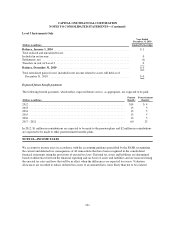
Level 1, 2 and 3 Valuation Techniques
Financial instruments are considered Level 1 when the valuation can be based on quoted prices in active markets
for identical assets or liabilities. Level 2 financial instruments are valued using quoted prices for similar assets or
liabilities, quoted prices in markets that are not active, or models using inputs that are observable or can be
corroborated by observable market data of substantially the full term of the assets or liabilities. Financial
instruments are considered Level 3 when their values are determined using pricing models, discounted cash flow
methodologies or similar techniques, and at least one significant model assumption or input is unobservable and
when determination of the fair value requires significant management judgment or estimation.
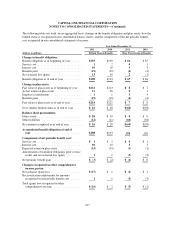
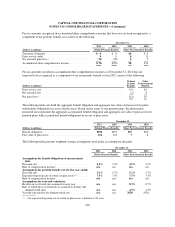
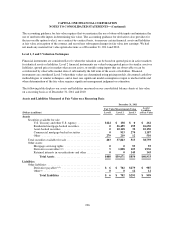
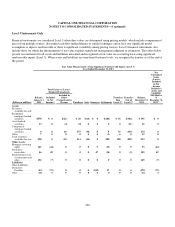
The following table displays our assets and liabilities measured on our consolidated balance sheets at fair value
on a recurring basis as of December 31, 2011 and 2010:
Assets and Liabilities Measured at Fair Value on a Recurring Basis
December 31, 2011
Fair Value Measurements Using Assets/
Liabilities
at Fair Value(Dollars in millions) Level 1 Level 2 Level 3
Assets
Securities available for sale:
U.S. Treasury and other U.S. Agency ................ $124 $ 138 $ 0 $ 262
Residential mortgage-backed securities ............... 0 26,455 195 26,650
Asset-backed securities ........................... 0 10,118 32 10,150
Commercial mortgage-backed securities .............. 0 913 274 1,187
Other ......................................... 279 219 12 510
Total securities available for sale ........................ 403 37,843 513 38,759
Other assets:
Mortgage servicing rights ......................... 0 0 93 93
Derivative receivables(1)(2) ......................... 5 1,828 103 1,936
Retained interests in securitizations and other .......... 0 0 145 145
Total Assets ................................ $408 $39,671 $854 $40,933
Liabilities
Other liabilities: .....................................
Derivative payables(1)(2) ........................... $ 6 $ 702 $279 $ 987
Other(3) ........................................ 0 0 12 12
Total Liabilities ............................ $ 6 $ 702 $291 $ 999
226