Capital One 2011 Annual Report Download - page 76
Download and view the complete annual report
Please find page 76 of the 2011 Capital One annual report below. You can navigate through the pages in the report by either clicking on the pages listed below, or by using the keyword search tool below to find specific information within the annual report.-
 1
1 -
2
-
3
-
4
-
5
-
6
-
7
-
8
-
9
-
10
-
11
-
12
-
13
-
14
-
15
-
16
-
17
-
18
-
19
-
20
-
21
-
22
-
23
-
24
-
25
-
26
-
27
-
28
-
29
-
30
-
31
-
32
-
33
-
34
-
35
-
36
-
37
-
38
-
39
-
40
-
41
-
42
-
43
-
44
-
45
-
46
-
47
-
48
-
49
-
50
-
51
-
52
-
53
-
54
-
55
-
56
-
57
-
58
-
59
-
60
-
61
-
62
-
63
-
64
-
65
-
 66
66 -
 67
67 -
 68
68 -
 69
69 -
 70
70 -
 71
71 -
 72
72 -
 73
73 -
 74
74 -
 75
75 -
 76
76 -
 77
77 -
 78
78 -
 79
79 -
 80
80 -
 81
81 -
 82
82 -
 83
83 -
 84
84 -
 85
85 -
 86
86 -
87
-
88
-
89
-
90
-
91
-
92
-
93
-
94
-
95
-
96
-
97
-
98
-
99
-
100
-
101
-
102
-
103
-
104
-
105
-
106
-
107
-
108
-
109
-
110
-
111
-
112
-
113
-
114
-
115
-
116
-
117
-
118
-
119
-
120
-
121
-
122
-
123
-
124
-
125
-
126
-
127
-
128
-
129
-
130
-
131
-
132
-
133
-
134
-
135
-
136
-
137
-
138
-
139
-
140
-
141
-
142
-
143
-
144
-
145
-
146
-
147
-
148
-
149
-
150
-
151
-
152
-
153
-
154
-
155
-
156
-
157
-
158
-
159
-
160
-
161
-
162
-
163
-
164
-
165
-
166
-
167
-
168
-
169
-
170
-
171
-
172
-
173
-
174
-
175
-
176
-
177
-
178
-
179
-
180
-
181
-
182
-
183
-
184
-
185
-
186
-
187
-
188
-
189
-
190
-
191
-
192
-
193
-
194
-
195
-
196
-
197
-
198
-
199
-
200
-
201
-
202
-
203
-
204
-
205
-
206
-
207
-
208
-
209
-
210
-
211
-
212
-
213
-
214
-
215
-
216
-
217
-
218
-
219
-
220
-
221
-
222
-
223
-
224
-
225
-
226
-
227
-
228
-
229
-
230
-
231
-
232
-
233
-
234
-
235
-
236
-
237
-
238
-
239
-
240
-
241
-
242
-
243
-
244
-
245
-
246
-
247
-
248
-
249
-
250
-
251
-
252
-
253
-
254
-
255
-
256
-
257
-
258
-
259
-
260
-
261
-
262
-
263
-
264
-
265
-
266
-
267
-
268
-
269
-
270
-
271
-
272
-
273
-
274
-
275
-
276
-
277
-
278
-
279
-
280
-
281
-
282
-
283
-
284
-
285
-
286
-
287
-
288
-
289
-
290
-
291
-
292
-
293
-
294
-
295
-
296
-
297
-
298
 |
 |

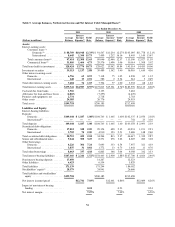
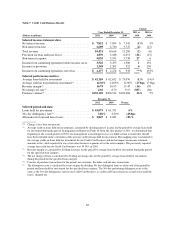
Table 2: Average Balances, Net Interest Income and Net Interest Yield (Reported Basis)(1)
Year Ended December 31,
2011 2010 2009
(Dollars in millions)
Average
Balance
Interest
Income/
Expense(2)
Yield/
Rate
Average
Balance
Interest
Income/
Expense(2)
Yield/
Rate
Average
Balance
Interest
Income/
Expense(2)
Yield/
Rate
Assets:
Interest-earning assets:
Consumer loans:(3)
Domestic(4) ............. $ 88,769 $10,948 12.33% $ 91,451 $11,228 12.28% $ 67,160 $ 6,901 10.28%
International ............ 8,645 1,360 15.73 7,499 1,212 16.16 2,613 348 13.32
Total consumer loans(4) ....... 97,414 12,308 12.63 98,950 12,440 12.57 69,773 7,249 10.39
Commercial loans(4) .......... 31,010 1,466 4.73 29,576 1,494 5.06 30,014 1,508 5.02
Total loans held for investment ..... 128,424 13,774 10.73 128,526 13,934 10.84 99,787 8,757 8.78
Investment securities ............. 39,513 1,137 2.88 39,489 1,342 3.40 36,910 1,610 4.36
Other interest-earning assets:
Domestic .................. 6,756 63 0.93 7,140 75 1.05 7,506 290 3.86
International ................ 648 13 2.01 586 2 0.34 1,107 7 0.63
Total other interest earning assets . . . 7,404 76 1.03 7,726 77 1.00 8,613 297 3.45
Total interest-earning assets ....... $175,341 $14,987 8.55% $175,741 $15,353 8.74% $145,310 $10,664 7.34%
Cash and due from banks ......... 1,926 2,132 3,481
Allowance for loan and lease
losses ....................... (4,865) (7,257) (4,470)
Premises and equipment, net ....... 2,731 2,718 2,718
Other assets .................... 24,585 26,780 24,559
Total assets .................... $199,718 $200,114 $171,598
Liabilities and Equity:
Interest-bearing liabilities:
Deposits:
Domestic .................. $109,644 $ 1,187 1.08% $104,743 $ 1,465 1.40% $102,337 $ 2,070 2.02%
International(5) .............. — —— — — — 741 23 3.10
Total deposits ................... 109,644 1,187 1.08 $104,743 $ 1,465 1.40 $103,078 $ 2,093 2.03
Securitized debt obligations:
Domestic .................. 17,012 348 2.05 29,275 686 2.34 5,516 282 5.11
International ................ 3,703 74 2.00 4,910 123 2.51 — — —
Total securitized debt obligations . . . 20,715 422 2.04 34,185 809 2.37 5,516 282 5.11
Senior and subordinated notes ...... 9,244 300 3.25 8,571 276 3.22 8,607 260 3.02
Other borrowings:
Domestic .................. 4,226 306 7.24 5,092 333 6.54 7,958 321 4.03
International ................ 3,837 31 0.81 1,772 13 0.73 1,441 11 0.76
Total other borrowings ........... 8,063 337 4.18 6,864 346 5.04 9,399 332 3.53
Total interest-bearing liabilities ..... $147,666 $ 2,246 1.52% $154,363 $ 2,896 1.88% $126,600 $ 2,967 2.34%
Non-interest bearing deposits ...... 17,050 14,267 12,523
Other liabilities ................. 6,423 6,543 5,869
Total liabilities .................. 171,139 175,173 144,992
Stockholders’ equity(6) ............ 28,579 24,941 26,606
Total liabilities and stockholders’
equity ....................... $199,718 $200,114 $171,598
Net interest income/spread ........ $12,741 7.03% $12,457 6.86% $ 7,697 5.00%
Impact of non-interest bearing
funding ...................... 0.24 0.23 0.30
Net interest margin .............. 7.27% 7.09% 5.30%
56