Capital One 2011 Annual Report Download - page 188
Download and view the complete annual report
Please find page 188 of the 2011 Capital One annual report below. You can navigate through the pages in the report by either clicking on the pages listed below, or by using the keyword search tool below to find specific information within the annual report.-
 1
1 -
2
-
3
-
4
-
5
-
6
-
7
-
8
-
9
-
10
-
11
-
12
-
13
-
14
-
15
-
16
-
17
-
18
-
19
-
20
-
21
-
22
-
23
-
24
-
25
-
26
-
27
-
28
-
29
-
30
-
31
-
32
-
33
-
34
-
35
-
36
-
37
-
38
-
39
-
40
-
41
-
42
-
43
-
44
-
45
-
46
-
47
-
48
-
49
-
50
-
51
-
52
-
53
-
54
-
55
-
56
-
57
-
58
-
59
-
60
-
61
-
62
-
63
-
64
-
65
-
66
-
67
-
68
-
69
-
70
-
71
-
72
-
73
-
74
-
75
-
76
-
77
-
78
-
79
-
80
-
81
-
82
-
83
-
84
-
85
-
86
-
87
-
88
-
89
-
90
-
91
-
92
-
93
-
94
-
95
-
96
-
97
-
98
-
99
-
100
-
101
-
102
-
103
-
104
-
105
-
106
-
107
-
108
-
109
-
110
-
111
-
112
-
113
-
114
-
115
-
116
-
117
-
118
-
119
-
120
-
121
-
122
-
123
-
124
-
125
-
126
-
127
-
128
-
129
-
130
-
131
-
132
-
133
-
134
-
135
-
136
-
137
-
138
-
139
-
140
-
141
-
142
-
143
-
144
-
145
-
146
-
147
-
148
-
149
-
150
-
151
-
152
-
153
-
154
-
155
-
156
-
157
-
158
-
159
-
160
-
161
-
162
-
163
-
164
-
165
-
166
-
167
-
168
-
169
-
170
-
171
-
172
-
173
-
174
-
175
-
176
-
177
-
 178
178 -
 179
179 -
 180
180 -
 181
181 -
 182
182 -
 183
183 -
 184
184 -
 185
185 -
 186
186 -
 187
187 -
 188
188 -
 189
189 -
 190
190 -
 191
191 -
 192
192 -
 193
193 -
 194
194 -
 195
195 -
 196
196 -
 197
197 -
 198
198 -
199
-
200
-
201
-
202
-
203
-
204
-
205
-
206
-
207
-
208
-
209
-
210
-
211
-
212
-
213
-
214
-
215
-
216
-
217
-
218
-
219
-
220
-
221
-
222
-
223
-
224
-
225
-
226
-
227
-
228
-
229
-
230
-
231
-
232
-
233
-
234
-
235
-
236
-
237
-
238
-
239
-
240
-
241
-
242
-
243
-
244
-
245
-
246
-
247
-
248
-
249
-
250
-
251
-
252
-
253
-
254
-
255
-
256
-
257
-
258
-
259
-
260
-
261
-
262
-
263
-
264
-
265
-
266
-
267
-
268
-
269
-
270
-
271
-
272
-
273
-
274
-
275
-
276
-
277
-
278
-
279
-
280
-
281
-
282
-
283
-
284
-
285
-
286
-
287
-
288
-
289
-
290
-
291
-
292
-
293
-
294
-
295
-
296
-
297
-
298
 |
 |

CAPITAL ONE FINANCIAL CORPORATION
NOTES TO CONSOLIDATED STATEMENTS—(Continued)
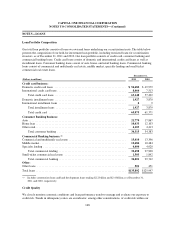
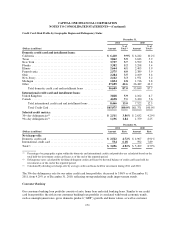
NOTE 5—LOANS
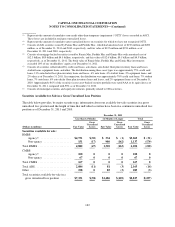
Loan Portfolio Composition
Our total loan portfolio consists of loans we own and loans underlying our securitization trusts. The table below
presents the composition of our held-for investment loan portfolio, including restricted loans for securitization
investors, as of December 31, 2011 and 2010. Our loan portfolio consists of credit card, consumer banking and
commercial banking loans. Credit card loans consist of domestic and international credit card loans as well as
installment loans. Consumer banking loans consist of auto, home, and retail banking loans. Commercial banking
loans consist of commercial and multifamily real estate, middle market, specialty lending and small-ticket
commercial real estate loans.
December 31,
(Dollars in millions) 2011 2010
Credit card business:
Domestic credit card loans .................................................. $ 54,682 $ 49,979
International credit card loans ................................................ 8,466 7,513
Total credit card loans .................................................. 63,148 57,492
Domestic installment loans .................................................. 1,927 3,870
International installment loans ............................................... 09
Total installment loans ................................................. 1,927 3,879
Total credit card ...................................................... 65,075 61,371
Consumer Banking business:
Auto .................................................................... 21,779 17,867
Home loan ............................................................... 10,433 12,103
Other retail ............................................................... 4,103 4,413
Total consumer banking ................................................ 36,315 34,383
Commercial Banking business:(1)
Commercial and multifamily real estate ........................................ 15,410 13,396
Middle market ............................................................ 12,684 10,484
Specialty lending .......................................................... 4,404 4,020
Total commercial lending ............................................... 32,498 27,900
Small-ticket commercial real estate ........................................... 1,503 1,842
Total commercial banking ............................................... 34,001 29,742
Other:
Other loans .............................................................. 501 451
Total loans ............................................................... $135,892 $125,947
(1) Includes construction loans and land development loans totaling $2.2 billion and $2.4 billion as of December 31,
2011 and 2010, respectively.
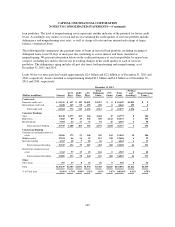
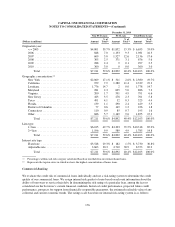
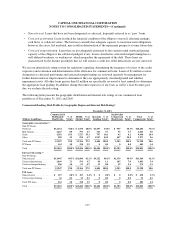
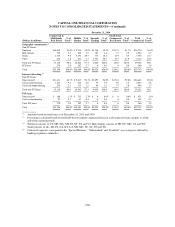
Credit Quality
We closely monitor economic conditions and loan performance trends to manage and evaluate our exposure to
credit risk. Trends in delinquency ratios are an indicator, among other considerations, of credit risk within our
168