Capital One 2011 Annual Report Download - page 248
Download and view the complete annual report
Please find page 248 of the 2011 Capital One annual report below. You can navigate through the pages in the report by either clicking on the pages listed below, or by using the keyword search tool below to find specific information within the annual report.-
 1
1 -
2
-
3
-
4
-
5
-
6
-
7
-
8
-
9
-
10
-
11
-
12
-
13
-
14
-
15
-
16
-
17
-
18
-
19
-
20
-
21
-
22
-
23
-
24
-
25
-
26
-
27
-
28
-
29
-
30
-
31
-
32
-
33
-
34
-
35
-
36
-
37
-
38
-
39
-
40
-
41
-
42
-
43
-
44
-
45
-
46
-
47
-
48
-
49
-
50
-
51
-
52
-
53
-
54
-
55
-
56
-
57
-
58
-
59
-
60
-
61
-
62
-
63
-
64
-
65
-
66
-
67
-
68
-
69
-
70
-
71
-
72
-
73
-
74
-
75
-
76
-
77
-
78
-
79
-
80
-
81
-
82
-
83
-
84
-
85
-
86
-
87
-
88
-
89
-
90
-
91
-
92
-
93
-
94
-
95
-
96
-
97
-
98
-
99
-
100
-
101
-
102
-
103
-
104
-
105
-
106
-
107
-
108
-
109
-
110
-
111
-
112
-
113
-
114
-
115
-
116
-
117
-
118
-
119
-
120
-
121
-
122
-
123
-
124
-
125
-
126
-
127
-
128
-
129
-
130
-
131
-
132
-
133
-
134
-
135
-
136
-
137
-
138
-
139
-
140
-
141
-
142
-
143
-
144
-
145
-
146
-
147
-
148
-
149
-
150
-
151
-
152
-
153
-
154
-
155
-
156
-
157
-
158
-
159
-
160
-
161
-
162
-
163
-
164
-
165
-
166
-
167
-
168
-
169
-
170
-
171
-
172
-
173
-
174
-
175
-
176
-
177
-
178
-
179
-
180
-
181
-
182
-
183
-
184
-
185
-
186
-
187
-
188
-
189
-
190
-
191
-
192
-
193
-
194
-
195
-
196
-
197
-
198
-
199
-
200
-
201
-
202
-
203
-
204
-
205
-
206
-
207
-
208
-
209
-
210
-
211
-
212
-
213
-
214
-
215
-
216
-
217
-
218
-
219
-
220
-
221
-
222
-
223
-
224
-
225
-
226
-
227
-
228
-
229
-
230
-
231
-
232
-
233
-
234
-
235
-
236
-
237
-
 238
238 -
 239
239 -
 240
240 -
 241
241 -
 242
242 -
 243
243 -
 244
244 -
 245
245 -
 246
246 -
 247
247 -
 248
248 -
 249
249 -
 250
250 -
 251
251 -
 252
252 -
 253
253 -
 254
254 -
 255
255 -
 256
256 -
 257
257 -
 258
258 -
259
-
260
-
261
-
262
-
263
-
264
-
265
-
266
-
267
-
268
-
269
-
270
-
271
-
272
-
273
-
274
-
275
-
276
-
277
-
278
-
279
-
280
-
281
-
282
-
283
-
284
-
285
-
286
-
287
-
288
-
289
-
290
-
291
-
292
-
293
-
294
-
295
-
296
-
297
-
298
 |
 |

CAPITAL ONE FINANCIAL CORPORATION
NOTES TO CONSOLIDATED STATEMENTS—(Continued)
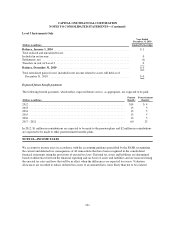
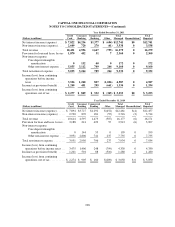
Level 3 Instruments Only
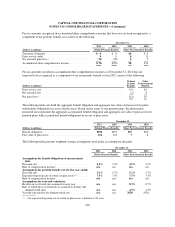
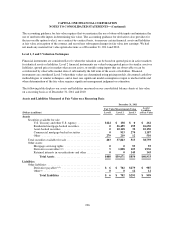
Financial instruments are considered Level 3 when their values are determined using pricing models, which include comparison of
prices from multiple sources, discounted cash flow methodologies or similar techniques and at least one significant model
assumption or input is unobservable or there is significant variability among pricing sources. Level 3 financial instruments also
include those for which the determination of fair value requires significant management judgment or estimation. The tables below
present reconciliation for all assets and liabilities measured and recognized at fair value on a recurring basis using significant
unobservable inputs (Level 3). When assets and liabilities are transferred between levels, we recognize the transfer as of the end of
the period.
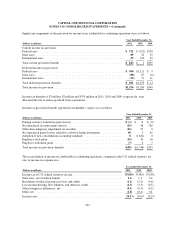
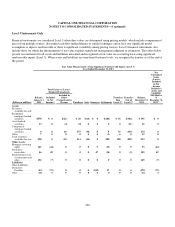
Fair Value Measurements Using Significant Unobservable Inputs (Level 3)
Year Ended December 31, 2011
Total Gains or (Losses)
(Realized/Unrealized)
Net
Unrealized
Gains
(Losses)
Included
in Net
Income
Related to
Assets and
Liabilities
Still Held as
of
December 31,
2011(3)
(Dollars in millions)
Balance,
January 1,
2011
Included
in Net
Income(1)
Included in
Other
Comprehensive
Income Purchases Sales Issuances Settlements
Transfers
Into
Level 3(2)
Transfers
Out of
Level 3(2)
Balance,
December 31,
2011
Assets:
Securities
available-for-sale:
Residential
mortgage-backed
securities ....... $578 $ 0 $(21) $ 20 $(14) $ 0 $(102) $ 76 $(342) $ 195 $ 0
Asset-backed
securities ....... 13 0 (4) 34 0 0 0 0 (11) 32 0
Commercial
mortgage-backed
securities ....... 0 0 10 357 (30) 0 0 76 (139) 274 0
Other ............ 7 0 0 0 0 0 (1) 6 0 12 0
Total securities
available-for-sale . 598 0 (15) 411 (44) 0 (103) 158 (492) 513 0
Other Assets:
Mortgage servicing
rights .......... 141 (44) 0 0 0 9 (13) 0 0 93 (44)
Derivative
receivables ...... 46 49 0 0 0 47 (34) 0 (5) 103 49
Retained interest in
securitization and
other ........... 152 (7) 0 0 0 0 0 0 0 145 (7)
Liabilities:
Other Liabilities
Derivative
Payables ........ (43) (75) 0 0 0 (182) 17 0 4 (279) (75)
Other ............. (18) 6 0 0 0 0 0 0 0 (12) 6
228