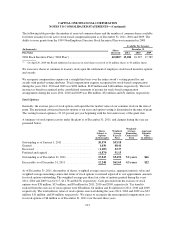
Capital One 2011 Annual Report Download - page 240
Download and view the complete annual report
Please find page 240 of the 2011 Capital One annual report below. You can navigate through the pages in the report by either clicking on the pages listed below, or by using the keyword search tool below to find specific information within the annual report.-
 1
1 -
2
-
3
-
4
-
5
-
6
-
7
-
8
-
9
-
10
-
11
-
12
-
13
-
14
-
15
-
16
-
17
-
18
-
19
-
20
-
21
-
22
-
23
-
24
-
25
-
26
-
27
-
28
-
29
-
30
-
31
-
32
-
33
-
34
-
35
-
36
-
37
-
38
-
39
-
40
-
41
-
42
-
43
-
44
-
45
-
46
-
47
-
48
-
49
-
50
-
51
-
52
-
53
-
54
-
55
-
56
-
57
-
58
-
59
-
60
-
61
-
62
-
63
-
64
-
65
-
66
-
67
-
68
-
69
-
70
-
71
-
72
-
73
-
74
-
75
-
76
-
77
-
78
-
79
-
80
-
81
-
82
-
83
-
84
-
85
-
86
-
87
-
88
-
89
-
90
-
91
-
92
-
93
-
94
-
95
-
96
-
97
-
98
-
99
-
100
-
101
-
102
-
103
-
104
-
105
-
106
-
107
-
108
-
109
-
110
-
111
-
112
-
113
-
114
-
115
-
116
-
117
-
118
-
119
-
120
-
121
-
122
-
123
-
124
-
125
-
126
-
127
-
128
-
129
-
130
-
131
-
132
-
133
-
134
-
135
-
136
-
137
-
138
-
139
-
140
-
141
-
142
-
143
-
144
-
145
-
146
-
147
-
148
-
149
-
150
-
151
-
152
-
153
-
154
-
155
-
156
-
157
-
158
-
159
-
160
-
161
-
162
-
163
-
164
-
165
-
166
-
167
-
168
-
169
-
170
-
171
-
172
-
173
-
174
-
175
-
176
-
177
-
178
-
179
-
180
-
181
-
182
-
183
-
184
-
185
-
186
-
187
-
188
-
189
-
190
-
191
-
192
-
193
-
194
-
195
-
196
-
197
-
198
-
199
-
200
-
201
-
202
-
203
-
204
-
205
-
206
-
207
-
208
-
209
-
210
-
211
-
212
-
213
-
214
-
215
-
216
-
217
-
218
-
219
-
220
-
221
-
222
-
223
-
224
-
225
-
226
-
227
-
228
-
229
-
 230
230 -
 231
231 -
 232
232 -
 233
233 -
 234
234 -
 235
235 -
 236
236 -
 237
237 -
 238
238 -
 239
239 -
 240
240 -
 241
241 -
 242
242 -
 243
243 -
 244
244 -
 245
245 -
 246
246 -
 247
247 -
 248
248 -
 249
249 -
 250
250 -
251
-
252
-
253
-
254
-
255
-
256
-
257
-
258
-
259
-
260
-
261
-
262
-
263
-
264
-
265
-
266
-
267
-
268
-
269
-
270
-
271
-
272
-
273
-
274
-
275
-
276
-
277
-
278
-
279
-
280
-
281
-
282
-
283
-
284
-
285
-
286
-
287
-
288
-
289
-
290
-
291
-
292
-
293
-
294
-
295
-
296
-
297
-
298
 |
 |

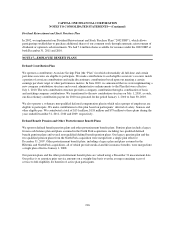
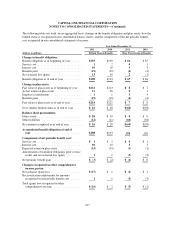
CAPITAL ONE FINANCIAL CORPORATION
NOTES TO CONSOLIDATED STATEMENTS—(Continued)
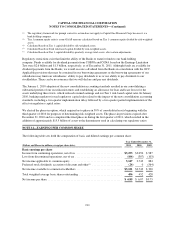
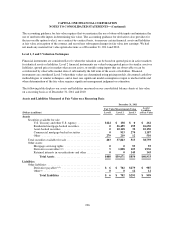
Fair Values Measurement
For information on fair value measurements, including descriptions of Level 1, 2 and 3 of the fair value hierarchy
and the valuation methods we utilize, see “Note 1—Summary of Significant Accounting Policies” and “Note
19—Fair Value of Financial Instruments.”
Plan Assets Measured at Fair Value on a Recurring Basis
December 31, 2011
(Dollars in millions) Fair Value Measurements Using Assets
at Fair ValueLevel 1 Level 2 Level 3
Plan Assets
Common collective trusts ................................... $0 $125 $0 $125
Short-term investment fund ................................. 0 00 0
Corporate bonds (S&P rating of A or higher) .................... 0 12 0 12
Corporate bonds (S&P rating of lower than A) .................. 0 22 0 22
Government securities ..................................... 0 46 0 46
Mortgage-backed securities ................................. 0 15 0 15
Municipal bonds .......................................... 0 10 1
Total ............................................... $0 $221 $0 $221
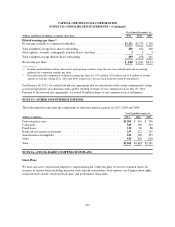
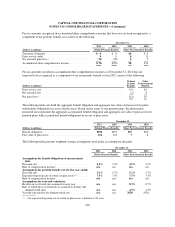
December 31, 2010
(Dollars in millions) Fair Value Measurements Using Assets
at Fair ValueLevel 1 Level 2 Level 3
Plan Assets
Common collective trusts ................................... $0 $169 $0 $169
Short-term investment fund ................................. 0 7 0 7
Corporate bonds (S&P rating of A or higher) .................... 0 2 0 2
Corporate bonds (S&P rating of lower than A) .................. 0 4 0 4
Government securities ..................................... 0 46 0 46
Mortgage-backed securities ................................. 0 1 0 1
Municipal bonds .......................................... 0 0 0 0
Total ............................................... $0 $229 $0 $229
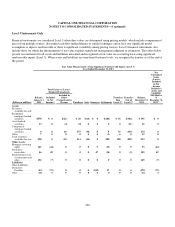
Financial instruments are considered Level 3 when their values are determined using pricing models, which
include comparison of prices from multiple sources, discounted cash flow methodologies or similar techniques
and at least one significant model assumption or input is unobservable or there is significant variability among
pricing sources. Level 3 financial instruments also include those for which the determination of fair value
requires significant management judgment or estimation. The table below presents a reconciliation for all plan
assets measured and recognized at fair value on a recurring basis using significant unobservable inputs (Level 3)
during 2010. We did not have any Level 3 plan assets for the year ended December 31, 2011.
220