Capital One 2011 Annual Report Download - page 6
Download and view the complete annual report
Please find page 6 of the 2011 Capital One annual report below. You can navigate through the pages in the report by either clicking on the pages listed below, or by using the keyword search tool below to find specific information within the annual report.-
 1
1 -
 2
2 -
 3
3 -
 4
4 -
 5
5 -
 6
6 -
 7
7 -
 8
8 -
 9
9 -
 10
10 -
 11
11 -
 12
12 -
 13
13 -
 14
14 -
 15
15 -
 16
16 -
 17
17 -
18
-
19
-
20
-
21
-
22
-
23
-
24
-
25
-
26
-
27
-
28
-
29
-
30
-
31
-
32
-
33
-
34
-
35
-
36
-
37
-
38
-
39
-
40
-
41
-
42
-
43
-
44
-
45
-
46
-
47
-
48
-
49
-
50
-
51
-
52
-
53
-
54
-
55
-
56
-
57
-
58
-
59
-
60
-
61
-
62
-
63
-
64
-
65
-
66
-
67
-
68
-
69
-
70
-
71
-
72
-
73
-
74
-
75
-
76
-
77
-
78
-
79
-
80
-
81
-
82
-
83
-
84
-
85
-
86
-
87
-
88
-
89
-
90
-
91
-
92
-
93
-
94
-
95
-
96
-
97
-
98
-
99
-
100
-
101
-
102
-
103
-
104
-
105
-
106
-
107
-
108
-
109
-
110
-
111
-
112
-
113
-
114
-
115
-
116
-
117
-
118
-
119
-
120
-
121
-
122
-
123
-
124
-
125
-
126
-
127
-
128
-
129
-
130
-
131
-
132
-
133
-
134
-
135
-
136
-
137
-
138
-
139
-
140
-
141
-
142
-
143
-
144
-
145
-
146
-
147
-
148
-
149
-
150
-
151
-
152
-
153
-
154
-
155
-
156
-
157
-
158
-
159
-
160
-
161
-
162
-
163
-
164
-
165
-
166
-
167
-
168
-
169
-
170
-
171
-
172
-
173
-
174
-
175
-
176
-
177
-
178
-
179
-
180
-
181
-
182
-
183
-
184
-
185
-
186
-
187
-
188
-
189
-
190
-
191
-
192
-
193
-
194
-
195
-
196
-
197
-
198
-
199
-
200
-
201
-
202
-
203
-
204
-
205
-
206
-
207
-
208
-
209
-
210
-
211
-
212
-
213
-
214
-
215
-
216
-
217
-
218
-
219
-
220
-
221
-
222
-
223
-
224
-
225
-
226
-
227
-
228
-
229
-
230
-
231
-
232
-
233
-
234
-
235
-
236
-
237
-
238
-
239
-
240
-
241
-
242
-
243
-
244
-
245
-
246
-
247
-
248
-
249
-
250
-
251
-
252
-
253
-
254
-
255
-
256
-
257
-
258
-
259
-
260
-
261
-
262
-
263
-
264
-
265
-
266
-
267
-
268
-
269
-
270
-
271
-
272
-
273
-
274
-
275
-
276
-
277
-
278
-
279
-
280
-
281
-
282
-
283
-
284
-
285
-
286
-
287
-
288
-
289
-
290
-
291
-
292
-
293
-
294
-
295
-
296
-
297
-
298
 |
 |

4
accounts and nearly $30 billion in credit card loans with strong risk-adjusted returns. HSBC’s U.S. credit card
business remained profitable throughout the recession. It has a well-established private label and co-branded
card business with an attractive set of partners including Neiman Marcus®, Saks Fifth Avenue®, AFL-CIO®,
and General Motors®. HSBC’s partnership business will catapult us to a leading position in this segment
by expanding our existing partnership business and by bringing us a strong platform for more growth.
Capital One delivered solid results across all of its businesses in 2011
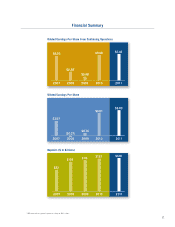
GAAP earnings for the year were $3.1 billion, or $6.80 per share, up $404 million year over year. Credit
improved significantly. Companywide, losses dropped from $6.7 billion, or 5.18%, in 2010 to $3.8 billion,
or 2.94%, in 2011 – a reduction of $2.9 billion. We returned to loan growth in 2011. Total Loans Held for
Investment grew nearly $10 billion, or 8%, to $136 billion at the end of 2011.
In a year when the KBW Bank Index dropped 24.6%, Capital One’s stock held its own, closing the year
at $42.29 per share, which is just about where it began.
Total Shareholder Return (TSR) was (0.2%) in 2011, and our TSR of 15.4% between January 1, 2008,
and February 29, 2012, puts us in a handful of banks that delivered positive TSR over that period, which
included the Great Recession and its continuing aftereffects. From our initial public offering in 1994
through February 29, 2012, Capital One produced a TSR of 975.2%.
Our credit card business produced industry-leading
profitability and returned to growth in 2011
For years, our Domestic Card business has delivered superior performance. In 2011 we generated $2.3
billion of net income, up from $1.9 billion in 2010. For the sixth consecutive year, our after-tax returns on
managed loans of 4.4% ranked near the top of the industry. We delivered these returns with a charge-off
rate of 4.7% which was below the industry average. The strong performance of our credit card business
through good times and bad is clear evidence of the power of Capital One’s information-based strategy.
We have increasing momentum in credit cards, and the trends across the business remain positive.
Domestic Card balances grew 9.4%, excluding the expected runoff of our installment loan portfolio. New
account bookings doubled. Our 15.5% growth in purchase volume continued to outpace the industry’s
growth rate. Revenue margin remained a strong 17%. Traction in new account growth and purchase
volume shows that we’re gaining market share.
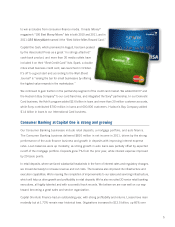
Our credit card business continued to launch and roll out compelling products in 2011. Venture, our
heavy-spender rewards card, was an immediate hit when it was launched early in 2010, and it has continued