Capital One 2011 Annual Report Download - page 107
Download and view the complete annual report
Please find page 107 of the 2011 Capital One annual report below. You can navigate through the pages in the report by either clicking on the pages listed below, or by using the keyword search tool below to find specific information within the annual report.-
 1
1 -
2
-
3
-
4
-
5
-
6
-
7
-
8
-
9
-
10
-
11
-
12
-
13
-
14
-
15
-
16
-
17
-
18
-
19
-
20
-
21
-
22
-
23
-
24
-
25
-
26
-
27
-
28
-
29
-
30
-
31
-
32
-
33
-
34
-
35
-
36
-
37
-
38
-
39
-
40
-
41
-
42
-
43
-
44
-
45
-
46
-
47
-
48
-
49
-
50
-
51
-
52
-
53
-
54
-
55
-
56
-
57
-
58
-
59
-
60
-
61
-
62
-
63
-
64
-
65
-
66
-
67
-
68
-
69
-
70
-
71
-
72
-
73
-
74
-
75
-
76
-
77
-
78
-
79
-
80
-
81
-
82
-
83
-
84
-
85
-
86
-
87
-
88
-
89
-
90
-
91
-
92
-
93
-
94
-
95
-
96
-
 97
97 -
 98
98 -
 99
99 -
 100
100 -
 101
101 -
 102
102 -
 103
103 -
 104
104 -
 105
105 -
 106
106 -
 107
107 -
 108
108 -
 109
109 -
 110
110 -
 111
111 -
 112
112 -
 113
113 -
 114
114 -
 115
115 -
 116
116 -
 117
117 -
118
-
119
-
120
-
121
-
122
-
123
-
124
-
125
-
126
-
127
-
128
-
129
-
130
-
131
-
132
-
133
-
134
-
135
-
136
-
137
-
138
-
139
-
140
-
141
-
142
-
143
-
144
-
145
-
146
-
147
-
148
-
149
-
150
-
151
-
152
-
153
-
154
-
155
-
156
-
157
-
158
-
159
-
160
-
161
-
162
-
163
-
164
-
165
-
166
-
167
-
168
-
169
-
170
-
171
-
172
-
173
-
174
-
175
-
176
-
177
-
178
-
179
-
180
-
181
-
182
-
183
-
184
-
185
-
186
-
187
-
188
-
189
-
190
-
191
-
192
-
193
-
194
-
195
-
196
-
197
-
198
-
199
-
200
-
201
-
202
-
203
-
204
-
205
-
206
-
207
-
208
-
209
-
210
-
211
-
212
-
213
-
214
-
215
-
216
-
217
-
218
-
219
-
220
-
221
-
222
-
223
-
224
-
225
-
226
-
227
-
228
-
229
-
230
-
231
-
232
-
233
-
234
-
235
-
236
-
237
-
238
-
239
-
240
-
241
-
242
-
243
-
244
-
245
-
246
-
247
-
248
-
249
-
250
-
251
-
252
-
253
-
254
-
255
-
256
-
257
-
258
-
259
-
260
-
261
-
262
-
263
-
264
-
265
-
266
-
267
-
268
-
269
-
270
-
271
-
272
-
273
-
274
-
275
-
276
-
277
-
278
-
279
-
280
-
281
-
282
-
283
-
284
-
285
-
286
-
287
-
288
-
289
-
290
-
291
-
292
-
293
-
294
-
295
-
296
-
297
-
298
 |
 |

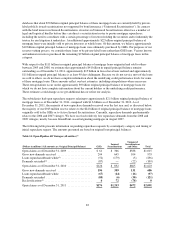
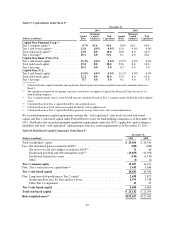
Table 17: Capital Ratios Under Basel I(1)
December 31,
2011 2010
(Dollars in millions)
Capital
Ratio
Minimum
Capital
Adequacy
Well
Capitalized
Capital
Ratio
Minimum
Capital
Adequacy
Well
Capitalized
Capital One Financial Corp:(2)
Tier 1 common equity(3) .................. 9.7% N/A N/A 8.8% N/A N/A
Tier 1 risk-based capital(4) ................. 12.0 4.0% 6.0% 11.6 4.0% 6.0%
Total risk-based capital(5) ................. 14.9 8.0 10.0 16.8 8.0 10.0
Tier 1 leverage(6) ........................ 10.1 4.0 N/A 8.1 4.0 N/A
Capital One Bank (USA) N.A.
Tier 1 risk-based capital .................. 11.2% 4.0% 6.0% 13.5% 4.0% 6.0%
Total risk-based capital ................... 15.0 8.0 10.0 23.6 8.0 10.0
Tier 1 leverage .......................... 10.2 4.0 5.0 8.3 4.0 5.0
Capital One, N.A.
Tier 1 risk-based capital .................. 11.0% 4.0% 6.0% 11.1% 4.0% 6.0%
Total risk-based capital ................... 12.2 8.0 10.0 12.4 8.0 10.0
Tier 1 leverage .......................... 8.7 4.0 5.0 8.1 4.0 5.0
(1) Calculated under capital standards and regulations based on the international capital framework commonly known as
Basel I.
(2) The regulatory framework for prompt corrective action does not apply to Capital One Financial Corp. because it is a
bank holding company.
(3) Tier 1 common equity ratio is a non-GAAP measure calculated based on Tier 1 common equity divided by risk-weighted
assets.
(4) Calculated based on Tier 1 capital divided by risk-weighted assets.
(5) Calculated based on Total risk-based capital divided by risk-weighted assets.
(6) Calculated based on Tier 1 capital divided by quarterly average total assets, after certain adjustments.
We exceeded minimum capital requirements and met the “well capitalized” ratio levels for total risk-based
capital and Tier 1 risk-based capital under Federal Reserve rules for bank holding companies as of December 31,
2011. The Banks also exceeded minimum regulatory requirements under the OCC’s applicable capital adequacy
guidelines and were “well capitalized” under prompt corrective action requirements as of December 31, 2011.
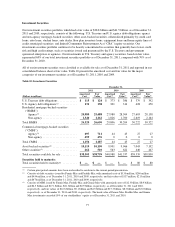
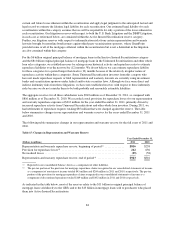
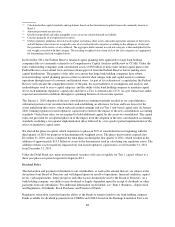
Table 18: Risk-Based Capital Components Under Basel I(1)
December 31,
(Dollars in millions) 2011 2010
Total stockholders’ equity ................................................. $ 29,666 $ 26,541
Less: Net unrealized gains recorded in AOCI(2) ................................ (289) (368)
Net losses on cash flow hedges recorded in AOCI(2) ....................... 71 86
Disallowed goodwill and other intangible assets(3) ......................... (13,855) (13,953)
Disallowed deferred tax assets ........................................ (534) (1,150)
Other ............................................................ (2) (2)
Tier 1 common equity ................................................... 15,057 11,154
Plus: Tier 1 restricted core capital items(4) .................................... 3,635 3,636
Tier 1 risk-based capital ................................................. 18,692 14,790
Plus: Long-term debt qualifying as Tier 2 capital .............................. 2,438 2,827
Qualifying allowance for loan and lease losses ............................ 1,979 3,748
Other Tier 2 components ............................................. 23 29
Tier 2 risk-based capital ................................................. 4,440 6,604
Total risk-based capital ................................................. $ 23,132 $ 21,394
Risk-weighted assets(5) .................................................. $155,657 $127,043
87