Capital One 2011 Annual Report Download - page 206
Download and view the complete annual report
Please find page 206 of the 2011 Capital One annual report below. You can navigate through the pages in the report by either clicking on the pages listed below, or by using the keyword search tool below to find specific information within the annual report.-
 1
1 -
2
-
3
-
4
-
5
-
6
-
7
-
8
-
9
-
10
-
11
-
12
-
13
-
14
-
15
-
16
-
17
-
18
-
19
-
20
-
21
-
22
-
23
-
24
-
25
-
26
-
27
-
28
-
29
-
30
-
31
-
32
-
33
-
34
-
35
-
36
-
37
-
38
-
39
-
40
-
41
-
42
-
43
-
44
-
45
-
46
-
47
-
48
-
49
-
50
-
51
-
52
-
53
-
54
-
55
-
56
-
57
-
58
-
59
-
60
-
61
-
62
-
63
-
64
-
65
-
66
-
67
-
68
-
69
-
70
-
71
-
72
-
73
-
74
-
75
-
76
-
77
-
78
-
79
-
80
-
81
-
82
-
83
-
84
-
85
-
86
-
87
-
88
-
89
-
90
-
91
-
92
-
93
-
94
-
95
-
96
-
97
-
98
-
99
-
100
-
101
-
102
-
103
-
104
-
105
-
106
-
107
-
108
-
109
-
110
-
111
-
112
-
113
-
114
-
115
-
116
-
117
-
118
-
119
-
120
-
121
-
122
-
123
-
124
-
125
-
126
-
127
-
128
-
129
-
130
-
131
-
132
-
133
-
134
-
135
-
136
-
137
-
138
-
139
-
140
-
141
-
142
-
143
-
144
-
145
-
146
-
147
-
148
-
149
-
150
-
151
-
152
-
153
-
154
-
155
-
156
-
157
-
158
-
159
-
160
-
161
-
162
-
163
-
164
-
165
-
166
-
167
-
168
-
169
-
170
-
171
-
172
-
173
-
174
-
175
-
176
-
177
-
178
-
179
-
180
-
181
-
182
-
183
-
184
-
185
-
186
-
187
-
188
-
189
-
190
-
191
-
192
-
193
-
194
-
195
-
 196
196 -
 197
197 -
 198
198 -
 199
199 -
 200
200 -
 201
201 -
 202
202 -
 203
203 -
 204
204 -
 205
205 -
 206
206 -
 207
207 -
 208
208 -
 209
209 -
 210
210 -
 211
211 -
 212
212 -
 213
213 -
 214
214 -
 215
215 -
 216
216 -
217
-
218
-
219
-
220
-
221
-
222
-
223
-
224
-
225
-
226
-
227
-
228
-
229
-
230
-
231
-
232
-
233
-
234
-
235
-
236
-
237
-
238
-
239
-
240
-
241
-
242
-
243
-
244
-
245
-
246
-
247
-
248
-
249
-
250
-
251
-
252
-
253
-
254
-
255
-
256
-
257
-
258
-
259
-
260
-
261
-
262
-
263
-
264
-
265
-
266
-
267
-
268
-
269
-
270
-
271
-
272
-
273
-
274
-
275
-
276
-
277
-
278
-
279
-
280
-
281
-
282
-
283
-
284
-
285
-
286
-
287
-
288
-
289
-
290
-
291
-
292
-
293
-
294
-
295
-
296
-
297
-
298
 |
 |

CAPITAL ONE FINANCIAL CORPORATION
NOTES TO CONSOLIDATED STATEMENTS—(Continued)
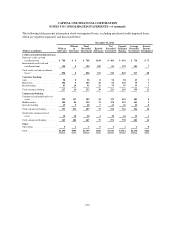
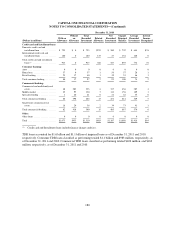
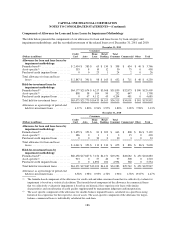
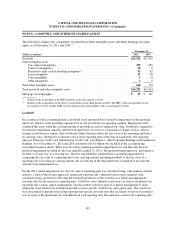
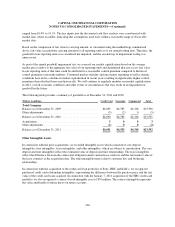
Components of Allowance for Loan and Lease Losses by Impairment Methodology
The table below presents the components of our allowance for loan and lease losses, by loan category and
impairment methodology, and the recorded investment of the related loans as of December 31, 2011 and 2010:
December 31, 2011
Consumer
(Dollars in millions)
Credit
Card Auto
Home
Loan
Retail
Banking
Total
Consumer Commercial Other Total
Allowance for loan and lease losses by
impairment methodology:
Formula-based(1) .....................$ 2,494 $ 383 $ 65 $ 150 $ 598 $ 634 $ 40 $ 3,766
Asset-specific(2) ...................... 353 8 10 12 30 75 0 458
Purchased credit impaired loans ......... 0 0 23 1 24 2 0 26
Total allowance for loan and lease
losses ............................$ 2,847 $ 391 $ 98 $ 163 $ 652 $ 711 $ 40 $ 4,250
Held-for-investment loans by
impairment methodology:
Formula-based(1) .....................$64,177 $21,674 $ 6,217 $3,968 $31,859 $32,873 $ 500 $129,409
Asset-specific(2) ...................... 898 58 104 90 252 647 1 1,798
Purchased credit impaired loans ......... 0 47 4,112 45 4,204 481 0 4,685
Total held-for-investment loans .........$65,075 $21,779 $10,433 $4,103 $36,315 $34,001 $ 501 $135,892
Allowance as a percentage of period-end
held-for-investment loans ............ 4.37% 1.80% 0.94% 3.97% 1.80% 2.09% 7.98% 3.13%
December 31, 2010
Consumer
(Dollars in millions)
Credit
Card Auto
Home
Loan
Retail
Banking
Total
Consumer Commercial Other Total
Allowance for loan and lease losses by
impairment methodology:
Formula-based(1) .....................$ 3,655 $ 353 $ 81 $ 209 $ 643 $ 808 $ 86 $ 5,192
Asset-specific(2) ...................... 386 0 1 1 2 15 0 403
Purchased credit impaired loans ......... 0 0 30 0 30 3 0 33
Total allowance for loan and lease
losses ............................$ 4,041 $ 353 $ 112 $ 210 $ 675 $ 826 $ 86 $ 5,628
Held-for-investment loans by
impairment methodology:
Formula-based(1) .....................$60,458 $17,867 $ 7,154 $4,271 $29,292 $28,682 $ 451 $118,883
Asset-specific(2) ...................... 913 0 57 40 97 500 0 1,510
Purchased credit impaired loans ......... 0 0 4,892 102 4,994 560 0 5,554
Total held-for-investment loans .........$61,371 $17,867 $12,103 $4,413 $34,383 $29,742 $ 451 $125,947
Allowance as a percentage of period-end
held-for-investment loans ............ 6.58% 1.98% 0.93% 4.76% 1.96% 2.78% 19.07% 4.47%
(1) The formula-based component of the allowance for credit card and other consumer loans that we collectively evaluate for
impairment is based on a statistical calculation. The formula-based component of the allowance for commercial loans
that we collectively evaluate for impairment is based on our historical loss experience for loans with similar
characteristics and consideration of credit quality supplemented by management judgement and interpretation.
(2) The asset specific component of the allowance for smaller-balance impaired loans is calculated on a pool basis using
historical loss experience for the respective class of assets. The asset-specific component of the allowance for larger-
balance, commercial loans is individually calculated for each loan.
186