Capital One 2011 Annual Report Download - page 133
Download and view the complete annual report
Please find page 133 of the 2011 Capital One annual report below. You can navigate through the pages in the report by either clicking on the pages listed below, or by using the keyword search tool below to find specific information within the annual report.-
 1
1 -
2
-
3
-
4
-
5
-
6
-
7
-
8
-
9
-
10
-
11
-
12
-
13
-
14
-
15
-
16
-
17
-
18
-
19
-
20
-
21
-
22
-
23
-
24
-
25
-
26
-
27
-
28
-
29
-
30
-
31
-
32
-
33
-
34
-
35
-
36
-
37
-
38
-
39
-
40
-
41
-
42
-
43
-
44
-
45
-
46
-
47
-
48
-
49
-
50
-
51
-
52
-
53
-
54
-
55
-
56
-
57
-
58
-
59
-
60
-
61
-
62
-
63
-
64
-
65
-
66
-
67
-
68
-
69
-
70
-
71
-
72
-
73
-
74
-
75
-
76
-
77
-
78
-
79
-
80
-
81
-
82
-
83
-
84
-
85
-
86
-
87
-
88
-
89
-
90
-
91
-
92
-
93
-
94
-
95
-
96
-
97
-
98
-
99
-
100
-
101
-
102
-
103
-
104
-
105
-
106
-
107
-
108
-
109
-
110
-
111
-
112
-
113
-
114
-
115
-
116
-
117
-
118
-
119
-
120
-
121
-
122
-
 123
123 -
 124
124 -
 125
125 -
 126
126 -
 127
127 -
 128
128 -
 129
129 -
 130
130 -
 131
131 -
 132
132 -
 133
133 -
 134
134 -
 135
135 -
 136
136 -
 137
137 -
 138
138 -
 139
139 -
 140
140 -
 141
141 -
 142
142 -
 143
143 -
144
-
145
-
146
-
147
-
148
-
149
-
150
-
151
-
152
-
153
-
154
-
155
-
156
-
157
-
158
-
159
-
160
-
161
-
162
-
163
-
164
-
165
-
166
-
167
-
168
-
169
-
170
-
171
-
172
-
173
-
174
-
175
-
176
-
177
-
178
-
179
-
180
-
181
-
182
-
183
-
184
-
185
-
186
-
187
-
188
-
189
-
190
-
191
-
192
-
193
-
194
-
195
-
196
-
197
-
198
-
199
-
200
-
201
-
202
-
203
-
204
-
205
-
206
-
207
-
208
-
209
-
210
-
211
-
212
-
213
-
214
-
215
-
216
-
217
-
218
-
219
-
220
-
221
-
222
-
223
-
224
-
225
-
226
-
227
-
228
-
229
-
230
-
231
-
232
-
233
-
234
-
235
-
236
-
237
-
238
-
239
-
240
-
241
-
242
-
243
-
244
-
245
-
246
-
247
-
248
-
249
-
250
-
251
-
252
-
253
-
254
-
255
-
256
-
257
-
258
-
259
-
260
-
261
-
262
-
263
-
264
-
265
-
266
-
267
-
268
-
269
-
270
-
271
-
272
-
273
-
274
-
275
-
276
-
277
-
278
-
279
-
280
-
281
-
282
-
283
-
284
-
285
-
286
-
287
-
288
-
289
-
290
-
291
-
292
-
293
-
294
-
295
-
296
-
297
-
298
 |
 |

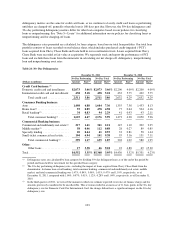
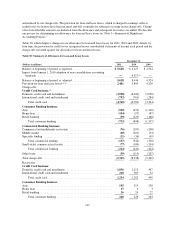
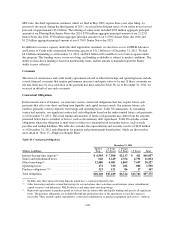
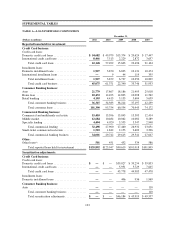
Table 31 presents an allocation of our allowance for loan and lease losses by loan category as of December 31,
2011 and 2010.
Table 31: Allocation of the Allowance for Loan and Lease Losses
December 31,
2011 2010
(Dollars in millions) Amount
% of Total
Loans(1) Amount
% of Total
Loans(1)
Credit Card:
Domestic credit card and installment(2) ...................... $ 2,375 4.20% $ 3,581 6.65%
International credit card and installment ..................... 472 5.58 460 6.12
Total credit card(2) .................................. 2,847 4.37 4,041 6.58
Consumer Banking:
Auto ................................................. 391 1.80 353 1.98
Home loan ............................................ 98 0.94 112 0.93
Retail banking ......................................... 163 3.97 210 4.76
Total consumer banking ............................. 652 1.80 675 1.96
Commercial Banking:
Commercial and multifamily real estate ..................... 411 2.67 495 3.70
Middle market ......................................... 128 1.01 162 1.55
Specialty lending ....................................... 71 1.61 91 2.26
Total commercial lending ............................ 610 1.88 748 2.68
Small-ticket commercial real estate ......................... 101 6.72 78 4.23
Total commercial banking ............................ 711 2.09 826 2.78
Other loans ............................................ 40 7.98 86 19.07
Total(2) ............................................... $ 4,250 3.13% $ 5,628 4.47%
Total allowance coverage ratios:
Period-end loans ....................................... $135,892 3.13% $125,947 4.47%
Nonperforming loans(3) .................................. 1,059 401.32 1,225 459.43
Allowance coverage ratios by loan category:
Credit card (30 + day delinquent loans) ...................... $ 2,511 113.38% $ 2,632 153.53%
Consumer banking (30 + day delinquent loans) ............... 2,176 29.96 2,050 32.93
Commercial banking (nonperforming loans) .................. 371 191.64 495 166.87
(1) Calculated based on the allowance for loan and lease losses attributable to each loan category divided by the outstanding
balance of loans within the specified loan category.
(2) The reduction in the provision for loan and lease losses attributable to Kohl’s was $257 million for 2011. Loss sharing
amounts attributable to Kohl’s reduced net charge-offs by $118 million in 2011. The expected reimbursement from
Kohl’s netted in our allowance for loan and lease losses was approximately $139 million as of December 31, 2011.
(3) As permitted by regulatory guidance issued by the FFEIC, our policy is generally not to classify credit card loans as
nonperforming. We accrue interest on credit card loans through the date of charge-off, typically in the period that the
loan becomes 180 days past due. The allowance for loan and lease losses as a percentage of nonperforming loans,
excluding the allowance related to our credit card loans, was 132.48% as of December 31, 2011 and 129.55% as of
December 31, 2010.
The reduction in our allowance reflected the continued improvement in credit performance trends across our
portfolios as a result of the slowly improving economy coupled with actions we have taken over the past several
years to tighten our underwriting standards and exit certain portfolios. While we reduced the amount of our
allowance for loan and lease losses in 2011, our allowance as a percentage of our total loan portfolio also
decreased to 3.13% as of December 31, 2011, from 4.47% as of December 31, 2010.
113