Capital One 2011 Annual Report Download - page 86
Download and view the complete annual report
Please find page 86 of the 2011 Capital One annual report below. You can navigate through the pages in the report by either clicking on the pages listed below, or by using the keyword search tool below to find specific information within the annual report.-
 1
1 -
2
-
3
-
4
-
5
-
6
-
7
-
8
-
9
-
10
-
11
-
12
-
13
-
14
-
15
-
16
-
17
-
18
-
19
-
20
-
21
-
22
-
23
-
24
-
25
-
26
-
27
-
28
-
29
-
30
-
31
-
32
-
33
-
34
-
35
-
36
-
37
-
38
-
39
-
40
-
41
-
42
-
43
-
44
-
45
-
46
-
47
-
48
-
49
-
50
-
51
-
52
-
53
-
54
-
55
-
56
-
57
-
58
-
59
-
60
-
61
-
62
-
63
-
64
-
65
-
66
-
67
-
68
-
69
-
70
-
71
-
72
-
73
-
74
-
75
-
 76
76 -
 77
77 -
 78
78 -
 79
79 -
 80
80 -
 81
81 -
 82
82 -
 83
83 -
 84
84 -
 85
85 -
 86
86 -
 87
87 -
 88
88 -
 89
89 -
 90
90 -
 91
91 -
 92
92 -
 93
93 -
 94
94 -
 95
95 -
 96
96 -
97
-
98
-
99
-
100
-
101
-
102
-
103
-
104
-
105
-
106
-
107
-
108
-
109
-
110
-
111
-
112
-
113
-
114
-
115
-
116
-
117
-
118
-
119
-
120
-
121
-
122
-
123
-
124
-
125
-
126
-
127
-
128
-
129
-
130
-
131
-
132
-
133
-
134
-
135
-
136
-
137
-
138
-
139
-
140
-
141
-
142
-
143
-
144
-
145
-
146
-
147
-
148
-
149
-
150
-
151
-
152
-
153
-
154
-
155
-
156
-
157
-
158
-
159
-
160
-
161
-
162
-
163
-
164
-
165
-
166
-
167
-
168
-
169
-
170
-
171
-
172
-
173
-
174
-
175
-
176
-
177
-
178
-
179
-
180
-
181
-
182
-
183
-
184
-
185
-
186
-
187
-
188
-
189
-
190
-
191
-
192
-
193
-
194
-
195
-
196
-
197
-
198
-
199
-
200
-
201
-
202
-
203
-
204
-
205
-
206
-
207
-
208
-
209
-
210
-
211
-
212
-
213
-
214
-
215
-
216
-
217
-
218
-
219
-
220
-
221
-
222
-
223
-
224
-
225
-
226
-
227
-
228
-
229
-
230
-
231
-
232
-
233
-
234
-
235
-
236
-
237
-
238
-
239
-
240
-
241
-
242
-
243
-
244
-
245
-
246
-
247
-
248
-
249
-
250
-
251
-
252
-
253
-
254
-
255
-
256
-
257
-
258
-
259
-
260
-
261
-
262
-
263
-
264
-
265
-
266
-
267
-
268
-
269
-
270
-
271
-
272
-
273
-
274
-
275
-
276
-
277
-
278
-
279
-
280
-
281
-
282
-
283
-
284
-
285
-
286
-
287
-
288
-
289
-
290
-
291
-
292
-
293
-
294
-
295
-
296
-
297
-
298
 |
 |
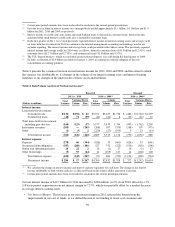
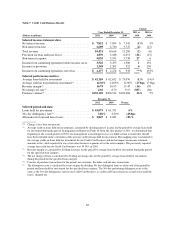
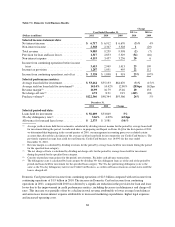
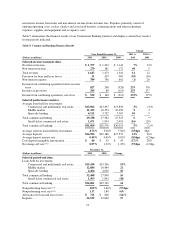
Key factors affecting the results of our Credit Card business for 2011, compared with 2010 included the
following:
•Net Interest Income: Net interest income decreased by $72 million, or 1%, in 2011, reflecting the impact of
a 1% decline in average loan balances. The expected run-off of the installment loan portfolio was the
primary driver of the decline in average loan balances in 2011, more than offsetting the additions of the
HBC and Kohl’s portfolios.
•Non-Interest Income: Non-interest income decreased by $111 million, or 4%, in 2011. The decrease reflects
the impact of contra-revenue amounts recorded in the second quarter and fourth quarters of 2011, including
a provision of $102 million for anticipated refunds to U.K. customers related to retrospective regulatory
requirements pertaining to payment protection insurance (“PPI”) in our U.K. business and the recognition of
expenses related to the periodic adjustment of our customer rewards points liability to reflect the estimated
cost of points earned to date that are ultimately expected to be redeemed. These decreases were partially
offset by higher net interchange fees during 2011, attributable to increased purchase volume.
•Provision for Loan and Lease Losses: The provision for loan and lease losses related to our Credit Card
business decreased by $1.3 billion in 2011, to $1.9 billion. The significant reduction in the provision was
primarily attributable to the continued improvement in credit performance, including reduced delinquency
rates and lower bankruptcy losses. As a result of the reduction in charge-offs and improvement in the net
charge-off rate, we recorded an allowance release for the Credit Card business of $1.2 billion in 2011
compared to $2.3 billion in 2010.
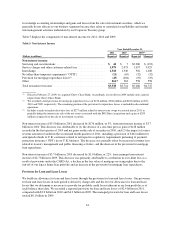
•Non-Interest Expense: Non-interest expense increased by $1.1 billion, or 27%, in 2011. The increase in
non-interest expense was attributable to increased marketing expenditures, higher legal expenses, and
increased operating cost. Additionally, we recorded $40 million in relation to regulatory requirements
pertaining to PPI in our U.K. business. We have expanded our marketing efforts to drive new business
volume through a variety of channels.
•Total Loans: Period-end loans in our Credit Card business increased by $3.7 billion, or 6%, in 2011, to
$65.1 billion as of December 31, 2011, from $61.4 billion as of December 31, 2010. The increase was
primarily attributable to the acquisitions of the Kohl’s credit card portfolio of $3.7 billion and the HBC
credit card portfolio of $1.4 billion, which were partially offset by the continued run-off of the installment
loan portfolio.
•Charge-off and Delinquency Statistics: Net charge-off and delinquency rates continued to improve in 2011.
The net charge-off rate decreased to 4.92% in 2011 from 8.79% in 2010. The 30+ day delinquency rate
decreased to 3.86% as of December 31, 2011, from 4.29% as of December 31, 2010. The improvement in
the net charge-off and delinquency rates reflects the impact of improved credit quality across our credit card
portfolio, tighter underwriting standards implemented over the last several years, and ongoing normalization
of credit performance in the portfolio.
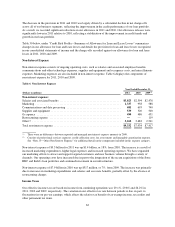
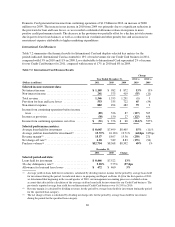
Key factors affecting the results of our Credit Card business for 2010, compared with 2009 included the
following:
•Net Interest Income: Our Credit Card business experienced an increase in net interest income of $352
million, or 5%, in 2010, which was primarily attributable to higher asset yields that more than offset a
decline in average loans held for investment. The increase in the average yield on our credit card loan
portfolio reflected the benefit of pricing changes that were implemented during 2009 and a reduction in the
level of loans with low introductory promotional rates. Net interest income also reflected the benefit of the
recognition into income of an increased amount of previously suppressed billed finance charges and fees as
a result of improving credit trends.
•Non-Interest Income: Non-interest income decreased by $1.0 billion, or 27%, in 2010. The decrease was
primarily attributable to a reduction in penalty fees resulting from the implementation of provisions of the
CARD Act and a reduction in customer accounts.
66