Capital One 2013 Annual Report Download - page 98
Download and view the complete annual report
Please find page 98 of the 2013 Capital One annual report below. You can navigate through the pages in the report by either clicking on the pages listed below, or by using the keyword search tool below to find specific information within the annual report.-
 1
1 -
2
-
3
-
4
-
5
-
6
-
7
-
8
-
9
-
10
-
11
-
12
-
13
-
14
-
15
-
16
-
17
-
18
-
19
-
20
-
21
-
22
-
23
-
24
-
25
-
26
-
27
-
28
-
29
-
30
-
31
-
32
-
33
-
34
-
35
-
36
-
37
-
38
-
39
-
40
-
41
-
42
-
43
-
44
-
45
-
46
-
47
-
48
-
49
-
50
-
51
-
52
-
53
-
54
-
55
-
56
-
57
-
58
-
59
-
60
-
61
-
62
-
63
-
64
-
65
-
66
-
67
-
68
-
69
-
70
-
71
-
72
-
73
-
74
-
75
-
76
-
77
-
78
-
79
-
80
-
81
-
82
-
83
-
84
-
85
-
86
-
87
-
 88
88 -
 89
89 -
 90
90 -
 91
91 -
 92
92 -
 93
93 -
 94
94 -
 95
95 -
 96
96 -
 97
97 -
 98
98 -
 99
99 -
 100
100 -
 101
101 -
 102
102 -
 103
103 -
 104
104 -
 105
105 -
 106
106 -
 107
107 -
 108
108 -
109
-
110
-
111
-
112
-
113
-
114
-
115
-
116
-
117
-
118
-
119
-
120
-
121
-
122
-
123
-
124
-
125
-
126
-
127
-
128
-
129
-
130
-
131
-
132
-
133
-
134
-
135
-
136
-
137
-
138
-
139
-
140
-
141
-
142
-
143
-
144
-
145
-
146
-
147
-
148
-
149
-
150
-
151
-
152
-
153
-
154
-
155
-
156
-
157
-
158
-
159
-
160
-
161
-
162
-
163
-
164
-
165
-
166
-
167
-
168
-
169
-
170
-
171
-
172
-
173
-
174
-
175
-
176
-
177
-
178
-
179
-
180
-
181
-
182
-
183
-
184
-
185
-
186
-
187
-
188
-
189
-
190
-
191
-
192
-
193
-
194
-
195
-
196
-
197
-
198
-
199
-
200
-
201
-
202
-
203
-
204
-
205
-
206
-
207
-
208
-
209
-
210
-
211
-
212
-
213
-
214
-
215
-
216
-
217
-
218
-
219
-
220
-
221
-
222
-
223
-
224
-
225
-
226
-
227
-
228
-
229
-
230
-
231
-
232
-
233
-
234
-
235
-
236
-
237
-
238
-
239
-
240
-
241
-
242
-
243
-
244
-
245
-
246
-
247
-
248
-
249
-
250
-
251
-
252
-
253
-
254
-
255
-
256
-
257
-
258
-
259
-
260
-
261
-
262
-
263
-
264
-
265
-
266
-
267
-
268
-
269
-
270
-
271
-
272
-
273
-
274
-
275
-
276
-
277
-
278
-
279
-
280
-
281
-
282
-
283
-
284
-
285
-
286
-
287
-
288
-
289
-
290
-
291
-
292
-
293
-
294
-
295
-
296
-
297
-
298
-
299
-
300
-
301
-
302
 |
 |

expenses that do not directly support the operations of the business segments or for which the business segments
are not considered financially accountable in evaluating their performance, such as certain acquisition and
restructuring charges; a portion of the provision for representation and warranty reserves related to continuing
operations; certain material items that are non-recurring in nature; and offsets related to certain line-item
reclassifications.
Net loss from continuing operations recorded in Other was $443 million in 2013, compared with net income from
continuing operations of $6 million in 2012 and a net loss from continuing operations of $428 million in 2011.
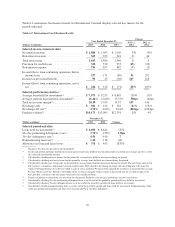
Table 9 summarizes the financial results of our Other category for the periods indicated.
Table 9: Other Results
Year Ended December 31,
(Dollars in millions) 2013 2012 2011
Selected income statement data:
Net interest income (expense) .......................................... $ (661) $(1,121) $ (913)
Non-interest income ................................................. (186) 607 (74)
Total net revenue ................................................... (847) (514) (987)
Provision for credit losses ............................................. (3) 35 7
Non-interest expense ................................................. 211 162 128
Income from continuing operations before income taxes ..................... (1,055) (711) (1,122)
Income tax benefit .................................................. (612) (717) (694)
Income (loss) from continuing operations, net of tax ........................ $ (443) $ 6 $ (428)
The shift in the Other category to a net loss from continuing operations of $443 million in 2013 from net income
from continuing operations of $6 million in 2012 was primarily due to three non-recurring items recognized in
2012 related to the ING Direct acquisition. We recognized a bargain purchase gain of $594 million related to the
ING Direct acquisition and an income of $162 million from the sale of Visa stock shares during the first quarter
of 2012, which was partially offset by a derivative loss of $78 million recognized in the first quarter of 2012
related to the interest rate swaps we entered into in 2011 to partially hedge the interest rate risk of the net assets
associated with the ING Direct acquisition.
The Other category shifted to net income from continuing operations of $6 million in 2012, from a net loss of
$428 million in 2011. The increase is primarily related to the three non-recurring items described above.
CONSOLIDATED BALANCE SHEETS ANALYSIS
Total assets of $297.0 billion as of December 31, 2013 decreased by $15.9 billion, or 5%, from $312.9 billion as
of December 31, 2012. Total liabilities of $255.3 billion as of December 31, 2013, decreased by $17.1 billion, or
6%, from $272.4 billion as of December 31, 2012. Stockholders’ equity increased by $1.2 billion to $41.7 billion
as of December 31, 2013. The increase in stockholders’ equity was primarily attributable to our net income of
$4.2 billion for 2013, which was partially offset by an other comprehensive loss of $1.6 billion, largely
attributable to an increase in interest rates in the second half of 2013 that reduced the fair value of our investment
securities classified as available for sale and resulted in net unrealized losses.
Following is a discussion of material changes in the major components of our assets and liabilities during 2013.
Period-end balance sheet amounts may vary from average balance sheet amounts due to liquidity and balance
sheet management activities that are intended to ensure the adequacy of capital while managing our ability to
manage liquidity requirements for the company and our customers and our market risk exposure in accordance
with our risk appetite.
78