Capital One 2013 Annual Report Download - page 63
Download and view the complete annual report
Please find page 63 of the 2013 Capital One annual report below. You can navigate through the pages in the report by either clicking on the pages listed below, or by using the keyword search tool below to find specific information within the annual report.-
 1
1 -
2
-
3
-
4
-
5
-
6
-
7
-
8
-
9
-
10
-
11
-
12
-
13
-
14
-
15
-
16
-
17
-
18
-
19
-
20
-
21
-
22
-
23
-
24
-
25
-
26
-
27
-
28
-
29
-
30
-
31
-
32
-
33
-
34
-
35
-
36
-
37
-
38
-
39
-
40
-
41
-
42
-
43
-
44
-
45
-
46
-
47
-
48
-
49
-
50
-
51
-
52
-
 53
53 -
 54
54 -
 55
55 -
 56
56 -
 57
57 -
 58
58 -
 59
59 -
 60
60 -
 61
61 -
 62
62 -
 63
63 -
 64
64 -
 65
65 -
 66
66 -
 67
67 -
 68
68 -
 69
69 -
 70
70 -
 71
71 -
 72
72 -
 73
73 -
74
-
75
-
76
-
77
-
78
-
79
-
80
-
81
-
82
-
83
-
84
-
85
-
86
-
87
-
88
-
89
-
90
-
91
-
92
-
93
-
94
-
95
-
96
-
97
-
98
-
99
-
100
-
101
-
102
-
103
-
104
-
105
-
106
-
107
-
108
-
109
-
110
-
111
-
112
-
113
-
114
-
115
-
116
-
117
-
118
-
119
-
120
-
121
-
122
-
123
-
124
-
125
-
126
-
127
-
128
-
129
-
130
-
131
-
132
-
133
-
134
-
135
-
136
-
137
-
138
-
139
-
140
-
141
-
142
-
143
-
144
-
145
-
146
-
147
-
148
-
149
-
150
-
151
-
152
-
153
-
154
-
155
-
156
-
157
-
158
-
159
-
160
-
161
-
162
-
163
-
164
-
165
-
166
-
167
-
168
-
169
-
170
-
171
-
172
-
173
-
174
-
175
-
176
-
177
-
178
-
179
-
180
-
181
-
182
-
183
-
184
-
185
-
186
-
187
-
188
-
189
-
190
-
191
-
192
-
193
-
194
-
195
-
196
-
197
-
198
-
199
-
200
-
201
-
202
-
203
-
204
-
205
-
206
-
207
-
208
-
209
-
210
-
211
-
212
-
213
-
214
-
215
-
216
-
217
-
218
-
219
-
220
-
221
-
222
-
223
-
224
-
225
-
226
-
227
-
228
-
229
-
230
-
231
-
232
-
233
-
234
-
235
-
236
-
237
-
238
-
239
-
240
-
241
-
242
-
243
-
244
-
245
-
246
-
247
-
248
-
249
-
250
-
251
-
252
-
253
-
254
-
255
-
256
-
257
-
258
-
259
-
260
-
261
-
262
-
263
-
264
-
265
-
266
-
267
-
268
-
269
-
270
-
271
-
272
-
273
-
274
-
275
-
276
-
277
-
278
-
279
-
280
-
281
-
282
-
283
-
284
-
285
-
286
-
287
-
288
-
289
-
290
-
291
-
292
-
293
-
294
-
295
-
296
-
297
-
298
-
299
-
300
-
301
-
302
 |
 |
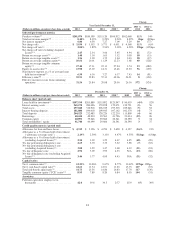
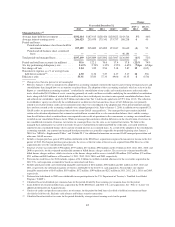
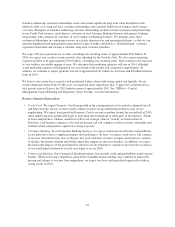
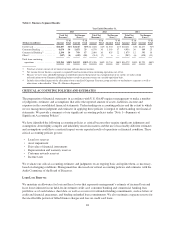
(11) Calculated based on net interest income for the period divided by average interest-earning assets for the period.
(12) Calculated based on net charge-offs for the period divided by average loans held for investment for the period.
(13) Calculation of ratio adjusted to exclude Acquired Loans from the denominator. See “MD&A—Business Segment Financial
Performance,” “MD&A—Credit Risk Profile” and “Note 4—Loans” for additional information on the impact of Acquired Loans on our
credit quality metrics.
(14) Calculated based on income from continuing operations, net of tax, for the period divided by average total assets for the period.
(15) Calculated based on income from continuing operations, net of tax, for the period divided by average tangible assets for the period. See
“MD&A—Supplemental Tables—Table F: Reconciliation of Non-GAAP Measures and Calculation of Regulatory Capital Measures
Under Basel I” for additional information.
(16) Calculated based on the sum of (i) income from continuing operations, net of tax; (ii) less dividends and undistributed earnings allocated
to participating securities; (iii) less preferred stock dividends, for the period, divided by average common equity. Our calculation of
return on average common equity may not be comparable to similarly titled measures reported by other companies.
(17) Calculated based on the sum of (i) income from continuing operations, net of tax; (ii) less dividends and undistributed earnings allocated
to participating securities; (iii) less preferred stock dividends, for the period, divided by average tangible common equity. Our calculation
of return on average tangible common equity may not be comparable to similarly titled measures reported by other companies. See
“MD&A—Supplemental Tables—Table F: Reconciliation of Non-GAAP Measures and Calculation of Regulatory Capital Measures
Under Basel I” for additional information.
(18) Calculated based on average stockholders’ equity for the period divided by average total assets for the period.
(19) Calculated based on non-interest expense for the period divided by average loans held for investment for the period.
(20) Calculated based on non-interest expense for the period divided by total net revenue for the period.
(21) Tier 1 common ratio is a regulatory capital measure calculated based on Tier 1 common equity divided by risk-weighted assets. See
“MD&A—Capital Management” and “MD&A—Supplemental Tables—Table F: Reconciliation of Non-GAAP Measures and
Calculation of Regulatory Capital Measures Under Basel I” for additional information, including the calculation of this ratio.
(22) Tier 1 risk-based capital ratio is a regulatory measure calculated based on Tier 1 capital divided by risk-weighted assets. See “MD&A—
Capital Management” and “MD&A—Supplemental Tables—Table F: Reconciliation of Non-GAAP Measures and Calculation of
Regulatory Capital Measures Under Basel I” for additional information, including the calculation of this ratio.
(23) Total risk-based capital ratio is a regulatory measure calculated based on total risk-based capital divided by risk-weighted assets. See
“MD&A—Capital Management” and “MD&A—Supplemental Tables—Table F: Reconciliation of Non-GAAP Measures and
Calculation of Regulatory Capital Measures Under Basel I” for additional information, including the calculation of this ratio.
(24) TCE ratio is a non-GAAP measure calculated based on tangible common equity divided by tangible assets. See “MD&A—Supplemental
Tables—Table F: Reconciliation of Non-GAAP Measures and Calculation of Regulatory Capital Measures Under Basel I” for the
calculation of this measure and reconciliation to the comparative GAAP measure. The TCE ratio as of December 31, 2013 has been
updated from 8.70% as reported in our Exhibit 99.2 of our Current Report Form 8-K as filed on January 16, 2014.
(25) See “MD&A—Supplemental Tables” and Exhibit 99.1 for a reconciliation of non-GAAP managed measures to comparable U.S. GAAP
measures.
43