Capital One 2013 Annual Report Download - page 296
Download and view the complete annual report
Please find page 296 of the 2013 Capital One annual report below. You can navigate through the pages in the report by either clicking on the pages listed below, or by using the keyword search tool below to find specific information within the annual report.-
 1
1 -
2
-
3
-
4
-
5
-
6
-
7
-
8
-
9
-
10
-
11
-
12
-
13
-
14
-
15
-
16
-
17
-
18
-
19
-
20
-
21
-
22
-
23
-
24
-
25
-
26
-
27
-
28
-
29
-
30
-
31
-
32
-
33
-
34
-
35
-
36
-
37
-
38
-
39
-
40
-
41
-
42
-
43
-
44
-
45
-
46
-
47
-
48
-
49
-
50
-
51
-
52
-
53
-
54
-
55
-
56
-
57
-
58
-
59
-
60
-
61
-
62
-
63
-
64
-
65
-
66
-
67
-
68
-
69
-
70
-
71
-
72
-
73
-
74
-
75
-
76
-
77
-
78
-
79
-
80
-
81
-
82
-
83
-
84
-
85
-
86
-
87
-
88
-
89
-
90
-
91
-
92
-
93
-
94
-
95
-
96
-
97
-
98
-
99
-
100
-
101
-
102
-
103
-
104
-
105
-
106
-
107
-
108
-
109
-
110
-
111
-
112
-
113
-
114
-
115
-
116
-
117
-
118
-
119
-
120
-
121
-
122
-
123
-
124
-
125
-
126
-
127
-
128
-
129
-
130
-
131
-
132
-
133
-
134
-
135
-
136
-
137
-
138
-
139
-
140
-
141
-
142
-
143
-
144
-
145
-
146
-
147
-
148
-
149
-
150
-
151
-
152
-
153
-
154
-
155
-
156
-
157
-
158
-
159
-
160
-
161
-
162
-
163
-
164
-
165
-
166
-
167
-
168
-
169
-
170
-
171
-
172
-
173
-
174
-
175
-
176
-
177
-
178
-
179
-
180
-
181
-
182
-
183
-
184
-
185
-
186
-
187
-
188
-
189
-
190
-
191
-
192
-
193
-
194
-
195
-
196
-
197
-
198
-
199
-
200
-
201
-
202
-
203
-
204
-
205
-
206
-
207
-
208
-
209
-
210
-
211
-
212
-
213
-
214
-
215
-
216
-
217
-
218
-
219
-
220
-
221
-
222
-
223
-
224
-
225
-
226
-
227
-
228
-
229
-
230
-
231
-
232
-
233
-
234
-
235
-
236
-
237
-
238
-
239
-
240
-
241
-
242
-
243
-
244
-
245
-
246
-
247
-
248
-
249
-
250
-
251
-
252
-
253
-
254
-
255
-
256
-
257
-
258
-
259
-
260
-
261
-
262
-
263
-
264
-
265
-
266
-
267
-
268
-
269
-
270
-
271
-
272
-
273
-
274
-
275
-
276
-
277
-
278
-
279
-
280
-
281
-
282
-
283
-
284
-
285
-
 286
286 -
 287
287 -
 288
288 -
 289
289 -
 290
290 -
 291
291 -
 292
292 -
 293
293 -
 294
294 -
 295
295 -
 296
296 -
 297
297 -
 298
298 -
 299
299 -
 300
300 -
 301
301 -
 302
302
 |
 |

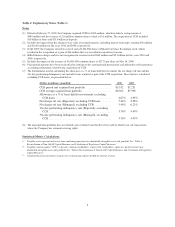
Table 2: Explanatory Notes (Table 1)
Notes
(1) Effective February 27, 2009, the Company acquired CCB for $476 million, which included a cash payment of
$445 million and the issuance of 2.6 million common shares valued at $31 million. The acquisition of CCB included
$10 billion in loans and $13.6 billion in deposits.
(2) Includes the impact from the change in fair value of retained interests, including interest-only strips, totaling $(5) million
and $(146) million for the years 2010 and 2009, respectively.
(3) In Q2 2009, the Company elected to convert and sell 404,508 shares of MasterCard class B common stock, which
resulted in the recognition of a gain of $66 million that was recorded in non-interest income.
(4) Billed finance charges and fees not recognized in revenue totaled $949 million and $2.1 billion for the years 2010 and
2009, respectively.
(5) Includes the impact of the issuance of 56,000,000 common shares at $27.75 per share on May 14, 2009.
(6) Prior period amounts have been reclassified to conform to the current period presentation and adjusted to reflect purchase
accounting refinements related to the acquisition of CCB.
(7) The denominator used in calculating the allowance as a % of loans held for investment, the net charge-off rate and the
30+ day performing delinquency rate includes loans acquired as part of the CCB acquisition. These metrics, calculated
excluding CCB loans, are presented below.
(Dollars in millions) (unaudited) 2010 2009
CCB period end acquired loan portfolio .................. $5,532 $7,251
CCB average acquired loan portfolio .................... $6,302 $7,996
Allowance as a % of loans held for investment, excluding
CCB loans ....................................... 4.67% 4.95%
Net charge-off rate (Reported), excluding CCB loans ....... 5.44% 4.98%
Net charge-off rate (Managed), excluding CCB ............ 5.44% 6.21%
30+ day performing delinquency rate (Reported), excluding
CCB............................................ 3.76% 4.49%
30+ day performing delinquency rate (Managed), excluding
CCB............................................ 3.76% 4.99%
(8) The managed loan portfolio does not include auto or home loans that have been sold in whole loan sale transactions
where the Company has retained servicing rights.
Statistical/Metric Calculations
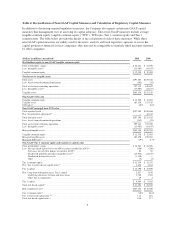
(A) Tangible assets represent total assets from continuing operations less identifiable intangible assets and goodwill. See “Table 4:
Reconciliation of Non-GAAP Capital Measures and Calculation of Regulatory Capital Measures.”
(B) Tangible common equity (“TCE”) represents common stockholders’ equity (total stockholders’ equity less preferred stock) less
identifiable intangible assets and goodwill. See “Table 4: Reconciliation of Non-GAAP Capital Measures and Calculation of Regulatory
Capital Measures.”
(C) Calculated based on non-interest expense less restructuring expense divided by total net revenue.
3