Capital One 2013 Annual Report Download - page 131
Download and view the complete annual report
Please find page 131 of the 2013 Capital One annual report below. You can navigate through the pages in the report by either clicking on the pages listed below, or by using the keyword search tool below to find specific information within the annual report.-
 1
1 -
2
-
3
-
4
-
5
-
6
-
7
-
8
-
9
-
10
-
11
-
12
-
13
-
14
-
15
-
16
-
17
-
18
-
19
-
20
-
21
-
22
-
23
-
24
-
25
-
26
-
27
-
28
-
29
-
30
-
31
-
32
-
33
-
34
-
35
-
36
-
37
-
38
-
39
-
40
-
41
-
42
-
43
-
44
-
45
-
46
-
47
-
48
-
49
-
50
-
51
-
52
-
53
-
54
-
55
-
56
-
57
-
58
-
59
-
60
-
61
-
62
-
63
-
64
-
65
-
66
-
67
-
68
-
69
-
70
-
71
-
72
-
73
-
74
-
75
-
76
-
77
-
78
-
79
-
80
-
81
-
82
-
83
-
84
-
85
-
86
-
87
-
88
-
89
-
90
-
91
-
92
-
93
-
94
-
95
-
96
-
97
-
98
-
99
-
100
-
101
-
102
-
103
-
104
-
105
-
106
-
107
-
108
-
109
-
110
-
111
-
112
-
113
-
114
-
115
-
116
-
117
-
118
-
119
-
120
-
 121
121 -
 122
122 -
 123
123 -
 124
124 -
 125
125 -
 126
126 -
 127
127 -
 128
128 -
 129
129 -
 130
130 -
 131
131 -
 132
132 -
 133
133 -
 134
134 -
 135
135 -
 136
136 -
 137
137 -
 138
138 -
 139
139 -
 140
140 -
 141
141 -
142
-
143
-
144
-
145
-
146
-
147
-
148
-
149
-
150
-
151
-
152
-
153
-
154
-
155
-
156
-
157
-
158
-
159
-
160
-
161
-
162
-
163
-
164
-
165
-
166
-
167
-
168
-
169
-
170
-
171
-
172
-
173
-
174
-
175
-
176
-
177
-
178
-
179
-
180
-
181
-
182
-
183
-
184
-
185
-
186
-
187
-
188
-
189
-
190
-
191
-
192
-
193
-
194
-
195
-
196
-
197
-
198
-
199
-
200
-
201
-
202
-
203
-
204
-
205
-
206
-
207
-
208
-
209
-
210
-
211
-
212
-
213
-
214
-
215
-
216
-
217
-
218
-
219
-
220
-
221
-
222
-
223
-
224
-
225
-
226
-
227
-
228
-
229
-
230
-
231
-
232
-
233
-
234
-
235
-
236
-
237
-
238
-
239
-
240
-
241
-
242
-
243
-
244
-
245
-
246
-
247
-
248
-
249
-
250
-
251
-
252
-
253
-
254
-
255
-
256
-
257
-
258
-
259
-
260
-
261
-
262
-
263
-
264
-
265
-
266
-
267
-
268
-
269
-
270
-
271
-
272
-
273
-
274
-
275
-
276
-
277
-
278
-
279
-
280
-
281
-
282
-
283
-
284
-
285
-
286
-
287
-
288
-
289
-
290
-
291
-
292
-
293
-
294
-
295
-
296
-
297
-
298
-
299
-
300
-
301
-
302
 |
 |

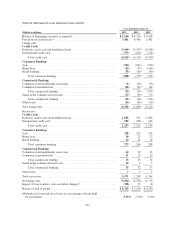
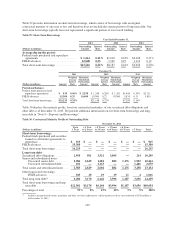
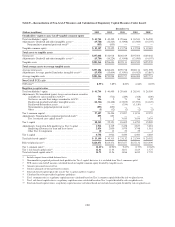
Table 32: Contractual Obligations
December 31, 2013
(Dollars in millions)
Up to
1 Year
> 1 Years
to 3 Years
> 3 Years
to 5 Years > 5 Years Total
Interest-bearing time deposits(1) ..................... $ 6,348 $ 2,983 $ 879 $ 123 $10,333
Securitized debt obligations ........................ 2,958 4,022 3,095 214 10,289
Other debt:
Federal funds purchased and securities loaned or sold
under agreements to repurchase ................... 915 — — — 915
Senior and subordinated notes ...................... 2,385 5,253 2,058 3,438 13,134
Other borrowings(2) ............................... 16,243 39 30 4 16,316
Total other debt .................................. 19,543 5,292 2,088 3,442 30,365
Operating leases ................................. 245 440 365 752 1,802
Purchase obligations(3)(4) ........................... 179 257 110 9 555
Total .......................................... $29,273 $12,994 $6,537 $4,540 $53,344
(1) Includes only those interest-bearing deposits which have a contractual maturity date.
(2) Other borrowings include FHLB advances.
(3) Represents agreements to purchase goods or services that are enforceable and legally binding and specify all significant terms. The
purchase obligations are included through the termination date of the agreements even if the contract is renewable. These include capital
expenditures, contractual commitments to purchase equipment and services, software acquisition/license commitments, contractual
minimum media commitments and any contractually required cash payments for acquisitions.
(4) Excludes funding commitments entered into in the ordinary course of business. See “Note 20—Commitments, Contingencies,
Guarantees, and Others” for further details.
MARKET RISK PROFILE
Market risk is inherent in the financial instruments associated with our operations and activities, including loans,
deposits, securities, short-term borrowings, long-term debt and derivatives. Below we provide additional
information about our primary sources of market risk, our market risk management strategies and the measures
we use to evaluate our market risk exposure.
Primary Market Risk Exposures
Our primary source of market risk is interest rate risk. We also have exposure to foreign exchange risk.
Interest Rate Risk
Interest rate risk, which represents exposure to instruments whose yield or price varies with the level or volatility
of interest rates, is our most significant source of market risk exposure. Banks are inevitably exposed to interest
rate risk due to differences in the timing between the maturities or repricing of assets and liabilities.
Foreign Exchange Risk
Foreign exchange risk represents exposure to changes in the values of current holdings and future cash flows
denominated in other currencies. Changes in foreign exchange rates affect the reported earnings of our foreign
operations and the non-dollar denominated equity invested in those foreign operations. We measure our earnings
exposure using a stress-based simulation of foreign exchange rates and manage it through the use of derivatives.
As of December 31, 2013 our earnings exposure to changes in foreign exchange rates was less than 2%. The
impact of changes in foreign exchange rates on our non-dollar equity invested overseas, measured on a quarterly
basis, manifests itself in our AOCI and capital ratios.
111