Capital One 2013 Annual Report Download - page 271
Download and view the complete annual report
Please find page 271 of the 2013 Capital One annual report below. You can navigate through the pages in the report by either clicking on the pages listed below, or by using the keyword search tool below to find specific information within the annual report.-
 1
1 -
2
-
3
-
4
-
5
-
6
-
7
-
8
-
9
-
10
-
11
-
12
-
13
-
14
-
15
-
16
-
17
-
18
-
19
-
20
-
21
-
22
-
23
-
24
-
25
-
26
-
27
-
28
-
29
-
30
-
31
-
32
-
33
-
34
-
35
-
36
-
37
-
38
-
39
-
40
-
41
-
42
-
43
-
44
-
45
-
46
-
47
-
48
-
49
-
50
-
51
-
52
-
53
-
54
-
55
-
56
-
57
-
58
-
59
-
60
-
61
-
62
-
63
-
64
-
65
-
66
-
67
-
68
-
69
-
70
-
71
-
72
-
73
-
74
-
75
-
76
-
77
-
78
-
79
-
80
-
81
-
82
-
83
-
84
-
85
-
86
-
87
-
88
-
89
-
90
-
91
-
92
-
93
-
94
-
95
-
96
-
97
-
98
-
99
-
100
-
101
-
102
-
103
-
104
-
105
-
106
-
107
-
108
-
109
-
110
-
111
-
112
-
113
-
114
-
115
-
116
-
117
-
118
-
119
-
120
-
121
-
122
-
123
-
124
-
125
-
126
-
127
-
128
-
129
-
130
-
131
-
132
-
133
-
134
-
135
-
136
-
137
-
138
-
139
-
140
-
141
-
142
-
143
-
144
-
145
-
146
-
147
-
148
-
149
-
150
-
151
-
152
-
153
-
154
-
155
-
156
-
157
-
158
-
159
-
160
-
161
-
162
-
163
-
164
-
165
-
166
-
167
-
168
-
169
-
170
-
171
-
172
-
173
-
174
-
175
-
176
-
177
-
178
-
179
-
180
-
181
-
182
-
183
-
184
-
185
-
186
-
187
-
188
-
189
-
190
-
191
-
192
-
193
-
194
-
195
-
196
-
197
-
198
-
199
-
200
-
201
-
202
-
203
-
204
-
205
-
206
-
207
-
208
-
209
-
210
-
211
-
212
-
213
-
214
-
215
-
216
-
217
-
218
-
219
-
220
-
221
-
222
-
223
-
224
-
225
-
226
-
227
-
228
-
229
-
230
-
231
-
232
-
233
-
234
-
235
-
236
-
237
-
238
-
239
-
240
-
241
-
242
-
243
-
244
-
245
-
246
-
247
-
248
-
249
-
250
-
251
-
252
-
253
-
254
-
255
-
256
-
257
-
258
-
259
-
260
-
 261
261 -
 262
262 -
 263
263 -
 264
264 -
 265
265 -
 266
266 -
 267
267 -
 268
268 -
 269
269 -
 270
270 -
 271
271 -
 272
272 -
 273
273 -
 274
274 -
 275
275 -
 276
276 -
 277
277 -
 278
278 -
 279
279 -
 280
280 -
 281
281 -
282
-
283
-
284
-
285
-
286
-
287
-
288
-
289
-
290
-
291
-
292
-
293
-
294
-
295
-
296
-
297
-
298
-
299
-
300
-
301
-
302
 |
 |

CAPITAL ONE FINANCIAL CORPORATION
NOTES TO CONSOLIDATED FINANCIAL STATEMENTS—(Continued)
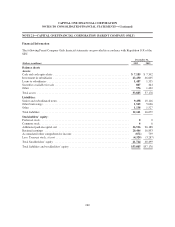
As indicated in the table below, most of the reserves relate to the $27 billion in original principal balance of
mortgage loans sold directly to the GSEs or to the Active Insured Securitizations.
Table 20.4: Allocation of Representation and Warranty Reserves
Reserve Liability
December 31, Loans Sold
2005 to 2008(1)
(Dollars in millions, except for loans sold) 2013 2012
Selected period-end data:
GSEs and Active Insured Securitizations ................................ $ 965 $817 $ 27
Inactive Insured Securitizations and Others .............................. 207 82 84
Total ............................................................ $1,172 $899 $111
(1) Reflects, in billions, the total original principal balance of mortgage loans originated by our subsidiaries and sold to third party investors
between 2005 and 2008.
In establishing reserves for the $11 billion original principal balance of GSE loans, we rely on the historical
relationship between GSE loan losses and repurchase outcomes for each GSE, adjusted for any settlements, to
estimate: (1) the percentage of current and future GSE loan defaults that we anticipate will result in repurchase
requests from the GSEs over the lifetime of the GSE loans; and, (2) the percentage of those repurchase requests
that we anticipate will result in actual repurchases. We rely on estimated collateral valuations and loss forecast
models to estimate our lifetime liability on GSE loans. This reserving approach to the GSE loans reflects the
historical interaction with the GSEs around repurchase requests, and also includes anticipated repurchases
resulting from mortgage insurance rescissions. Although our assumed future claims rate considers the most
recent claims experience and actual repurchases, an increase in GSE claims and/or repurchases could result in an
increase in our reserve. We have entered into and completed repurchase or settlement agreements with respect to
the majority of our exposure within this category.
Our reserves also could be impacted by any claims which may be brought by governmental agencies under the
Financial Institutions Reform, Recovery, and Enforcement Act (“FIRREA”), the False Claims Act, or other
federal or state statutes. For example, in 2013, GreenPoint and Capital One received requests for information
and/or subpoenas from various governmental regulators and law enforcement authorities, including members of
the RMBS Working Group, a federal and state law enforcement effort focused on investigating fraud and abuse
in the RMBS Market relating to the mortgage originations, mortgage loan sales, and the mortgage securitization
process. We are cooperating with these regulators and other authorities in responding to such requests.
For the $16 billion original principal balance in Active Insured Securitizations, our reserving approach reflects
our historical interaction with monoline bond insurers around repurchase requests. Typically, monoline bond
insurers allege a very high repurchase rate with respect to the mortgage loans in the Active Insured Securitization
category. In response to these repurchase requests, our subsidiaries typically request information from the
monoline bond insurers demonstrating that the contractual requirements around a valid repurchase request have
been satisfied. In response to these requests for supporting documentation, monoline bond insurers typically
initiate litigation. Accordingly, our reserves within the Active Insured Securitization segment are not based upon
the historical repurchase rate with monoline bond insurers, but rather upon the expected resolution of litigation
with the monoline bond insurers. Every bond insurer within this category is pursuing a substantially similar
litigation strategy either through active or probable litigation. Accordingly, our representation and warranty
reserves for this category are litigation reserves.
251