Capital One 2013 Annual Report Download - page 89
Download and view the complete annual report
Please find page 89 of the 2013 Capital One annual report below. You can navigate through the pages in the report by either clicking on the pages listed below, or by using the keyword search tool below to find specific information within the annual report.-
 1
1 -
2
-
3
-
4
-
5
-
6
-
7
-
8
-
9
-
10
-
11
-
12
-
13
-
14
-
15
-
16
-
17
-
18
-
19
-
20
-
21
-
22
-
23
-
24
-
25
-
26
-
27
-
28
-
29
-
30
-
31
-
32
-
33
-
34
-
35
-
36
-
37
-
38
-
39
-
40
-
41
-
42
-
43
-
44
-
45
-
46
-
47
-
48
-
49
-
50
-
51
-
52
-
53
-
54
-
55
-
56
-
57
-
58
-
59
-
60
-
61
-
62
-
63
-
64
-
65
-
66
-
67
-
68
-
69
-
70
-
71
-
72
-
73
-
74
-
75
-
76
-
77
-
78
-
 79
79 -
 80
80 -
 81
81 -
 82
82 -
 83
83 -
 84
84 -
 85
85 -
 86
86 -
 87
87 -
 88
88 -
 89
89 -
 90
90 -
 91
91 -
 92
92 -
 93
93 -
 94
94 -
 95
95 -
 96
96 -
 97
97 -
 98
98 -
 99
99 -
100
-
101
-
102
-
103
-
104
-
105
-
106
-
107
-
108
-
109
-
110
-
111
-
112
-
113
-
114
-
115
-
116
-
117
-
118
-
119
-
120
-
121
-
122
-
123
-
124
-
125
-
126
-
127
-
128
-
129
-
130
-
131
-
132
-
133
-
134
-
135
-
136
-
137
-
138
-
139
-
140
-
141
-
142
-
143
-
144
-
145
-
146
-
147
-
148
-
149
-
150
-
151
-
152
-
153
-
154
-
155
-
156
-
157
-
158
-
159
-
160
-
161
-
162
-
163
-
164
-
165
-
166
-
167
-
168
-
169
-
170
-
171
-
172
-
173
-
174
-
175
-
176
-
177
-
178
-
179
-
180
-
181
-
182
-
183
-
184
-
185
-
186
-
187
-
188
-
189
-
190
-
191
-
192
-
193
-
194
-
195
-
196
-
197
-
198
-
199
-
200
-
201
-
202
-
203
-
204
-
205
-
206
-
207
-
208
-
209
-
210
-
211
-
212
-
213
-
214
-
215
-
216
-
217
-
218
-
219
-
220
-
221
-
222
-
223
-
224
-
225
-
226
-
227
-
228
-
229
-
230
-
231
-
232
-
233
-
234
-
235
-
236
-
237
-
238
-
239
-
240
-
241
-
242
-
243
-
244
-
245
-
246
-
247
-
248
-
249
-
250
-
251
-
252
-
253
-
254
-
255
-
256
-
257
-
258
-
259
-
260
-
261
-
262
-
263
-
264
-
265
-
266
-
267
-
268
-
269
-
270
-
271
-
272
-
273
-
274
-
275
-
276
-
277
-
278
-
279
-
280
-
281
-
282
-
283
-
284
-
285
-
286
-
287
-
288
-
289
-
290
-
291
-
292
-
293
-
294
-
295
-
296
-
297
-
298
-
299
-
300
-
301
-
302
 |
 |
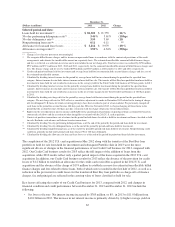
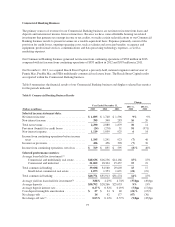
(6) Consists of credit card purchase transactions, net of returns, for the period for both loans classified as held for investment and loans
classified as held for sale. Excludes cash advance and balance transfer transactions
(7) Calculated by dividing 30+ day delinquent loans as of the end of the period by period-end loans held for investment.
Because our Domestic Card business accounts for the substantial majority of our Credit Card business, the key
factors driving the results for this division are similar to the key factors affecting our total Credit Card business.
The primary drivers of the improvement in results for our Domestic Card business in 2013, compared with 2012
included: (i) higher interest income primarily driven by higher average yield on loans held for investment driven
largely by the transfer of the Best Buy loan portfolio to the held for sale category in the first quarter of 2013, as
well as the absence of the charge recorded in the second quarter of 2012 to establish the finance charge and fee
reserve for the acquired credit card loans; (ii) the increase in interest and non interest income in 2013 due to the
full year impact of 2012 U.S. card acquisition and (iii) the absence of provision for credit losses of $1.2 billion
recorded in the second quarter of 2012 to establish an allowance for acquired credit card loans. These impacts
were partially offset by higher operating expenses attributable to the addition of loans and increased amortization
of intangibles and other assets associated with the 2012 U.S. card acquisition.
Domestic Card generated net income from continuing operations of $1.4 billion in 2012, compared with net
income from continuing operations of $2.3 billion in 2011. The decrease in Domestic Card net income in 2012
from 2011 reflected an increase in total net revenue largely due to the addition of loans from the 2012 U.S. card
acquisition, which was more than offset by the unfavorable impact of several items related to the 2012 U.S. card
acquisition. These items included: (i) a significant increase in the provision for credit losses resulting from an
initial allowance build of $1.2 billion related to the portfolio purchased in the 2012 U.S. card acquisition; and
(ii) an increase in non-interest expense largely resulting from operating expenses related to the 2012 U.S. card
acquisition and the amortization of intangibles and other assets associated with the 2012 U.S. card acquisition,
including PCCR intangible amortization expense of $350 million in 2012.
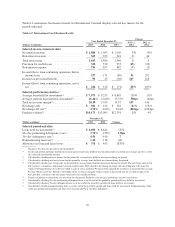
International Card Business
International Card generated net income from continuing operations of $234 million in 2013, compared with net
income from continuing operations of $126 million in 2012 and a net loss from continuing operations of $51
million in 2011. International Card accounted for 10% of total net revenues for our Credit Card business in 2013,
compared with 11% in 2012 and 13% in 2011. Income attributable to International Card represented 9% of
income for our Credit Card business in 2013, compared with 8% of the net income for 2012. Our International
Card business posted a loss that represented 2% of income for our Credit Card business in 2011.
69