Capital One 2013 Annual Report Download - page 185
Download and view the complete annual report
Please find page 185 of the 2013 Capital One annual report below. You can navigate through the pages in the report by either clicking on the pages listed below, or by using the keyword search tool below to find specific information within the annual report.-
 1
1 -
2
-
3
-
4
-
5
-
6
-
7
-
8
-
9
-
10
-
11
-
12
-
13
-
14
-
15
-
16
-
17
-
18
-
19
-
20
-
21
-
22
-
23
-
24
-
25
-
26
-
27
-
28
-
29
-
30
-
31
-
32
-
33
-
34
-
35
-
36
-
37
-
38
-
39
-
40
-
41
-
42
-
43
-
44
-
45
-
46
-
47
-
48
-
49
-
50
-
51
-
52
-
53
-
54
-
55
-
56
-
57
-
58
-
59
-
60
-
61
-
62
-
63
-
64
-
65
-
66
-
67
-
68
-
69
-
70
-
71
-
72
-
73
-
74
-
75
-
76
-
77
-
78
-
79
-
80
-
81
-
82
-
83
-
84
-
85
-
86
-
87
-
88
-
89
-
90
-
91
-
92
-
93
-
94
-
95
-
96
-
97
-
98
-
99
-
100
-
101
-
102
-
103
-
104
-
105
-
106
-
107
-
108
-
109
-
110
-
111
-
112
-
113
-
114
-
115
-
116
-
117
-
118
-
119
-
120
-
121
-
122
-
123
-
124
-
125
-
126
-
127
-
128
-
129
-
130
-
131
-
132
-
133
-
134
-
135
-
136
-
137
-
138
-
139
-
140
-
141
-
142
-
143
-
144
-
145
-
146
-
147
-
148
-
149
-
150
-
151
-
152
-
153
-
154
-
155
-
156
-
157
-
158
-
159
-
160
-
161
-
162
-
163
-
164
-
165
-
166
-
167
-
168
-
169
-
170
-
171
-
172
-
173
-
174
-
 175
175 -
 176
176 -
 177
177 -
 178
178 -
 179
179 -
 180
180 -
 181
181 -
 182
182 -
 183
183 -
 184
184 -
 185
185 -
 186
186 -
 187
187 -
 188
188 -
 189
189 -
 190
190 -
 191
191 -
 192
192 -
 193
193 -
 194
194 -
 195
195 -
196
-
197
-
198
-
199
-
200
-
201
-
202
-
203
-
204
-
205
-
206
-
207
-
208
-
209
-
210
-
211
-
212
-
213
-
214
-
215
-
216
-
217
-
218
-
219
-
220
-
221
-
222
-
223
-
224
-
225
-
226
-
227
-
228
-
229
-
230
-
231
-
232
-
233
-
234
-
235
-
236
-
237
-
238
-
239
-
240
-
241
-
242
-
243
-
244
-
245
-
246
-
247
-
248
-
249
-
250
-
251
-
252
-
253
-
254
-
255
-
256
-
257
-
258
-
259
-
260
-
261
-
262
-
263
-
264
-
265
-
266
-
267
-
268
-
269
-
270
-
271
-
272
-
273
-
274
-
275
-
276
-
277
-
278
-
279
-
280
-
281
-
282
-
283
-
284
-
285
-
286
-
287
-
288
-
289
-
290
-
291
-
292
-
293
-
294
-
295
-
296
-
297
-
298
-
299
-
300
-
301
-
302
 |
 |

CAPITAL ONE FINANCIAL CORPORATION
NOTES TO CONSOLIDATED FINANCIAL STATEMENTS—(Continued)
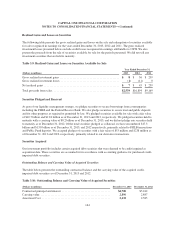
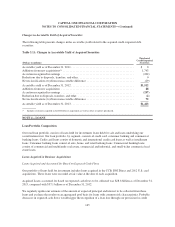
Changes in Accretable Yield of Acquired Securities
The following table presents changes in the accretable yield related to the acquired credit-impaired debt
securities:
Table 3.11: Changes in Accretable Yield of Acquired Securities
(Dollars in millions)
Purchased
Credit-Impaired
Securities
Accretable yield as of December 31, 2011 ............................................ $ 0
Additions from new acquisitions(1) .................................................. 1,743
Accretion recognized in earnings ................................................... (202)
Reductions due to disposals, transfers, and other ....................................... 0
Net reclassifications (to)/from nonaccretable difference ................................. (29)
Accretable yield as of December 31, 2012 ............................................ $1,512
Additions from new acquisitions ................................................... 88
Accretion recognized in earnings ................................................... (247)
Reduction due to disposals, transfers, and other ....................................... (2)
Net reclassifications (to)/from nonaccretable difference ................................. 72
Accretable yield as of December 31, 2013 ............................................ $1,423
(1) Includes securities acquired in the ING Direct acquisition as well as other securities purchased.
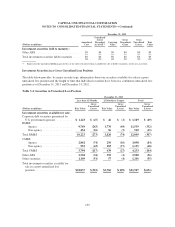
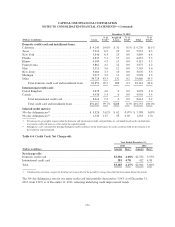
NOTE 4—LOANS
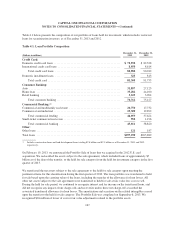
Loan Portfolio Composition
Our total loan portfolio consists of loans held for investment, loans held for sale and loans underlying our
securitization trust. Our loan portfolio, by segment, consists of credit card, consumer banking and commercial
banking loans. Credit card loans consist of domestic and international credit card loans as well as installment
loans. Consumer banking loans consist of auto, home, and retail banking loans. Commercial banking loans
consist of commercial and multifamily real estate, commercial and industrial, and small-ticket commercial real
estate loans.
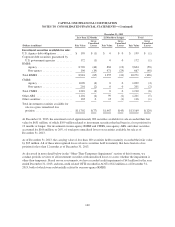
Loans Acquired in Business Acquisitions
Loans Acquired and Accounted for Based on Expected Cash Flows
Our portfolio of loans held for investment includes loans acquired in the CCB, ING Direct and 2012 U.S. card
acquisitions. These loans were recorded at fair value at the date of each acquisition.
Acquired Loans accounted for based on expected cash flows to be collected was $28.6 billion as of December 31,
2013, compared with $37.1 billion as of December 31, 2012.
We regularly update our estimate of the amount of expected principal and interest to be collected from these
loans and evaluate the results on an aggregated pool basis for loans with common risk characteristics. Probable
decreases in expected cash flows would trigger the recognition of a loan loss through our provision for credit
165