Capital One 2013 Annual Report Download - page 265
Download and view the complete annual report
Please find page 265 of the 2013 Capital One annual report below. You can navigate through the pages in the report by either clicking on the pages listed below, or by using the keyword search tool below to find specific information within the annual report.-
 1
1 -
2
-
3
-
4
-
5
-
6
-
7
-
8
-
9
-
10
-
11
-
12
-
13
-
14
-
15
-
16
-
17
-
18
-
19
-
20
-
21
-
22
-
23
-
24
-
25
-
26
-
27
-
28
-
29
-
30
-
31
-
32
-
33
-
34
-
35
-
36
-
37
-
38
-
39
-
40
-
41
-
42
-
43
-
44
-
45
-
46
-
47
-
48
-
49
-
50
-
51
-
52
-
53
-
54
-
55
-
56
-
57
-
58
-
59
-
60
-
61
-
62
-
63
-
64
-
65
-
66
-
67
-
68
-
69
-
70
-
71
-
72
-
73
-
74
-
75
-
76
-
77
-
78
-
79
-
80
-
81
-
82
-
83
-
84
-
85
-
86
-
87
-
88
-
89
-
90
-
91
-
92
-
93
-
94
-
95
-
96
-
97
-
98
-
99
-
100
-
101
-
102
-
103
-
104
-
105
-
106
-
107
-
108
-
109
-
110
-
111
-
112
-
113
-
114
-
115
-
116
-
117
-
118
-
119
-
120
-
121
-
122
-
123
-
124
-
125
-
126
-
127
-
128
-
129
-
130
-
131
-
132
-
133
-
134
-
135
-
136
-
137
-
138
-
139
-
140
-
141
-
142
-
143
-
144
-
145
-
146
-
147
-
148
-
149
-
150
-
151
-
152
-
153
-
154
-
155
-
156
-
157
-
158
-
159
-
160
-
161
-
162
-
163
-
164
-
165
-
166
-
167
-
168
-
169
-
170
-
171
-
172
-
173
-
174
-
175
-
176
-
177
-
178
-
179
-
180
-
181
-
182
-
183
-
184
-
185
-
186
-
187
-
188
-
189
-
190
-
191
-
192
-
193
-
194
-
195
-
196
-
197
-
198
-
199
-
200
-
201
-
202
-
203
-
204
-
205
-
206
-
207
-
208
-
209
-
210
-
211
-
212
-
213
-
214
-
215
-
216
-
217
-
218
-
219
-
220
-
221
-
222
-
223
-
224
-
225
-
226
-
227
-
228
-
229
-
230
-
231
-
232
-
233
-
234
-
235
-
236
-
237
-
238
-
239
-
240
-
241
-
242
-
243
-
244
-
245
-
246
-
247
-
248
-
249
-
250
-
251
-
252
-
253
-
254
-
 255
255 -
 256
256 -
 257
257 -
 258
258 -
 259
259 -
 260
260 -
 261
261 -
 262
262 -
 263
263 -
 264
264 -
 265
265 -
 266
266 -
 267
267 -
 268
268 -
 269
269 -
 270
270 -
 271
271 -
 272
272 -
 273
273 -
 274
274 -
 275
275 -
276
-
277
-
278
-
279
-
280
-
281
-
282
-
283
-
284
-
285
-
286
-
287
-
288
-
289
-
290
-
291
-
292
-
293
-
294
-
295
-
296
-
297
-
298
-
299
-
300
-
301
-
302
 |
 |

CAPITAL ONE FINANCIAL CORPORATION
NOTES TO CONSOLIDATED FINANCIAL STATEMENTS—(Continued)
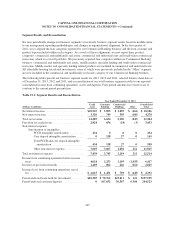
Segment Results and Reconciliation
We may periodically change our business segments or reclassify business segment results based on modifications
to our management reporting methodologies and changes in organizational alignment. In the first quarter of
2012, we re-aligned the loan categories reported by our Commercial Banking business and the loan customer and
product types included within each category. As a result of this re-alignment, we now report three product
categories: commercial and multifamily real estate, commercial and industrial loans and small-ticket commercial
real estate, which is a run-off portfolio. We previously reported four categories within our Commercial Banking
business: commercial and multifamily real estate, middle market, specialty lending and small-ticket commercial
real estate. Middle market and specialty lending related products are included in commercial and industrial loans.
All affordable housing tax-related investments, some of which were previously included in the “Other” segment,
are now included in the commercial and multifamily real estate category of our Commercial Banking business.
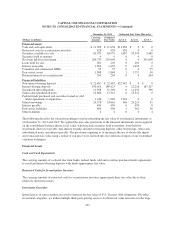
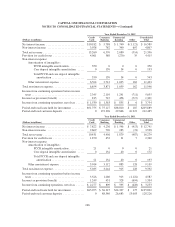
The following tables present our business segment results for 2013, 2012 and 2011, selected balance sheet data as
of December 31, 2013, 2012 and 2011, and a reconciliation of our total business segment results to our reported
consolidated income from continuing operations, assets and deposits. Prior period amounts have been recast to
conform to the current period presentation.
Table 19.1: Segment Results and Reconciliation
Year Ended December 31, 2013
(Dollars in millions)
Credit
Card
Consumer
Banking
Commercial
Banking Other
Consolidated
Total
Net interest income ........................... $10,967 $ 5,905 $ 1,895 $ (661) $ 18,106
Non-interest income ........................... 3,320 749 395 (186) 4,278
Total net revenue ............................. 14,287 6,654 2,290 (847) 22,384
Provision for credit losses ...................... 2,824 656 (24) (3) 3,453
Non-interest expense:
Amortization of intangibles:
PCCR intangible amortization ........... 434 0 0 0 434
Core deposit intangible amortization ...... 0 138 27 0 165
Total PCCR and core deposit intangible
amortization ....................... 434 138 27 0 599
Other non-interest expense .............. 7,005 3,607 1,092 211 11,915
Total non-interest expense ...................... 7,439 3,745 1,119 211 12,514
Income from continuing operations before income
taxes ..................................... 4,024 2,253 1,195 (1,055) 6,417
Income tax provision (benefit) ................... 1,409 802 426 (612) 2,025
Income (loss) from continuing operations, net of
tax....................................... $ 2,615 $ 1,451 $ 769 $ (443) $ 4,392
Period-end total loans held for investment ......... $81,305 $ 70,762 $45,011 $ 121 $197,199
Period-end total customer deposits ............... 0 167,652 30,567 6,304 204,523
245