Capital One 2013 Annual Report Download - page 96
Download and view the complete annual report
Please find page 96 of the 2013 Capital One annual report below. You can navigate through the pages in the report by either clicking on the pages listed below, or by using the keyword search tool below to find specific information within the annual report.-
 1
1 -
2
-
3
-
4
-
5
-
6
-
7
-
8
-
9
-
10
-
11
-
12
-
13
-
14
-
15
-
16
-
17
-
18
-
19
-
20
-
21
-
22
-
23
-
24
-
25
-
26
-
27
-
28
-
29
-
30
-
31
-
32
-
33
-
34
-
35
-
36
-
37
-
38
-
39
-
40
-
41
-
42
-
43
-
44
-
45
-
46
-
47
-
48
-
49
-
50
-
51
-
52
-
53
-
54
-
55
-
56
-
57
-
58
-
59
-
60
-
61
-
62
-
63
-
64
-
65
-
66
-
67
-
68
-
69
-
70
-
71
-
72
-
73
-
74
-
75
-
76
-
77
-
78
-
79
-
80
-
81
-
82
-
83
-
84
-
85
-
 86
86 -
 87
87 -
 88
88 -
 89
89 -
 90
90 -
 91
91 -
 92
92 -
 93
93 -
 94
94 -
 95
95 -
 96
96 -
 97
97 -
 98
98 -
 99
99 -
 100
100 -
 101
101 -
 102
102 -
 103
103 -
 104
104 -
 105
105 -
 106
106 -
107
-
108
-
109
-
110
-
111
-
112
-
113
-
114
-
115
-
116
-
117
-
118
-
119
-
120
-
121
-
122
-
123
-
124
-
125
-
126
-
127
-
128
-
129
-
130
-
131
-
132
-
133
-
134
-
135
-
136
-
137
-
138
-
139
-
140
-
141
-
142
-
143
-
144
-
145
-
146
-
147
-
148
-
149
-
150
-
151
-
152
-
153
-
154
-
155
-
156
-
157
-
158
-
159
-
160
-
161
-
162
-
163
-
164
-
165
-
166
-
167
-
168
-
169
-
170
-
171
-
172
-
173
-
174
-
175
-
176
-
177
-
178
-
179
-
180
-
181
-
182
-
183
-
184
-
185
-
186
-
187
-
188
-
189
-
190
-
191
-
192
-
193
-
194
-
195
-
196
-
197
-
198
-
199
-
200
-
201
-
202
-
203
-
204
-
205
-
206
-
207
-
208
-
209
-
210
-
211
-
212
-
213
-
214
-
215
-
216
-
217
-
218
-
219
-
220
-
221
-
222
-
223
-
224
-
225
-
226
-
227
-
228
-
229
-
230
-
231
-
232
-
233
-
234
-
235
-
236
-
237
-
238
-
239
-
240
-
241
-
242
-
243
-
244
-
245
-
246
-
247
-
248
-
249
-
250
-
251
-
252
-
253
-
254
-
255
-
256
-
257
-
258
-
259
-
260
-
261
-
262
-
263
-
264
-
265
-
266
-
267
-
268
-
269
-
270
-
271
-
272
-
273
-
274
-
275
-
276
-
277
-
278
-
279
-
280
-
281
-
282
-
283
-
284
-
285
-
286
-
287
-
288
-
289
-
290
-
291
-
292
-
293
-
294
-
295
-
296
-
297
-
298
-
299
-
300
-
301
-
302
 |
 |

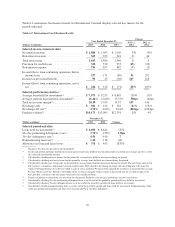
(Dollars in millions)
December 31,
2013 2012 Change
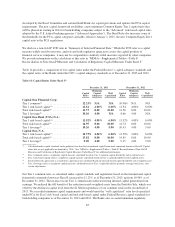
Selected period-end data:
Loans held for investment:
Commercial and multifamily real estate .......... $20,750 $17,732 17%
Commercial and industrial ..................... 23,309 19,892 17
Total commercial lending .......................... 44,059 37,624 17
Small-ticket commercial real estate .............. 952 1,196 (20)
Total commercial banking ......................... $45,011 $38,820 16%
Nonperforming loans rate(4) ........................ 0.33% 0.73% (40)bps
Nonperforming asset rate(5) ........................ 0.37 0.77 (40)
Allowance for loan and lease losses .................. $ 338 $ 433 (22)%
Allowance coverage ratio(6) ........................ 0.75% 1.12% (37)bps
Deposits ....................................... $30,567 $29,866 2%
** Change is less than one percent or not meaningful.
(1) Loans held for investment includes loans acquired in the ING Direct and CCB acquisitions. The carrying value of commercial banking
Acquired Loans accounted for subsequent to acquisition based on expected cash flows to be collected was $262 million and $359
million as of December 31, 2013 and 2012, respectively. The average balance of commercial banking loans held for investment,
excluding Acquired Loans, was $40.5 billion, $35.1 billion and $30.8 billion in 2013, 2012 and 2011, respectively.
(2) Calculated by dividing interest income for the period by average loans held for investment during the period.
(3) Calculated by dividing net charge-offs for the period by average loans held for investment during the period.
(4) Calculated by dividing nonperforming loans as of the end of the period by period-end loans held for investment. Nonperforming loans
generally include loans that have been placed on non-accrual status and certain restructured loans whose contractual terms have been
restructured in a manner that grants a concession to a borrower experiencing financial difficulty.
(5) Calculated by dividing nonperforming assets as of the end of the period by the sum of period-end loans held for investment, foreclosed
properties, and other foreclosed assets.
(6) Calculated by dividing the allowance for loan and lease losses as of the end of the period by period-end loans held for investment.
Key factors affecting the results of our Commercial Banking business for 2013, compared with 2012, and
changes in financial condition and credit performance between December 31, 2013 and December 31, 2012
include the following:
•Net Interest Income: Net interest income increased by $155 million, or 9%, in 2013 to $1.9 billion. The
increase was primarily driven by growth in our commercial lending business and higher deposit balances.
•Non-Interest Income: Non-interest income increased by $55 million, or 16%, in 2013 to $395 million,
driven by increased revenue related to fee-based products and services from the Beech Street Capital
acquisition.
•Provision for Credit Losses: The Commercial Banking business recorded a benefit related to the provision
for credit losses of $24 million in 2013, compared with a benefit of $270 million in 2012. The stabilization
of the credit outlook has resulted in less allowance release in the current year when compared to the prior
year. The combined release for allowance and reserve for unfunded lending commitments was $43 million
in 2013, compared with a release of $313 million in 2012.
•Non-Interest Expense: Non-interest expense increased by $60 million, or 6%, in 2013 to $1.1 billion, driven
by investments in business growth and infrastructure enhancements and the costs associated with Beech
Street Capital.
•Loans Held for Investment: Period-end loans held for investment in our Commercial Banking business
increased by $6.2 billion, or 16%, in 2013, to $45.0 billion as of December 31, 2013. The increase was
76