Capital One 2013 Annual Report Download - page 83
Download and view the complete annual report
Please find page 83 of the 2013 Capital One annual report below. You can navigate through the pages in the report by either clicking on the pages listed below, or by using the keyword search tool below to find specific information within the annual report.-
 1
1 -
2
-
3
-
4
-
5
-
6
-
7
-
8
-
9
-
10
-
11
-
12
-
13
-
14
-
15
-
16
-
17
-
18
-
19
-
20
-
21
-
22
-
23
-
24
-
25
-
26
-
27
-
28
-
29
-
30
-
31
-
32
-
33
-
34
-
35
-
36
-
37
-
38
-
39
-
40
-
41
-
42
-
43
-
44
-
45
-
46
-
47
-
48
-
49
-
50
-
51
-
52
-
53
-
54
-
55
-
56
-
57
-
58
-
59
-
60
-
61
-
62
-
63
-
64
-
65
-
66
-
67
-
68
-
69
-
70
-
71
-
72
-
 73
73 -
 74
74 -
 75
75 -
 76
76 -
 77
77 -
 78
78 -
 79
79 -
 80
80 -
 81
81 -
 82
82 -
 83
83 -
 84
84 -
 85
85 -
 86
86 -
 87
87 -
 88
88 -
 89
89 -
 90
90 -
 91
91 -
 92
92 -
 93
93 -
94
-
95
-
96
-
97
-
98
-
99
-
100
-
101
-
102
-
103
-
104
-
105
-
106
-
107
-
108
-
109
-
110
-
111
-
112
-
113
-
114
-
115
-
116
-
117
-
118
-
119
-
120
-
121
-
122
-
123
-
124
-
125
-
126
-
127
-
128
-
129
-
130
-
131
-
132
-
133
-
134
-
135
-
136
-
137
-
138
-
139
-
140
-
141
-
142
-
143
-
144
-
145
-
146
-
147
-
148
-
149
-
150
-
151
-
152
-
153
-
154
-
155
-
156
-
157
-
158
-
159
-
160
-
161
-
162
-
163
-
164
-
165
-
166
-
167
-
168
-
169
-
170
-
171
-
172
-
173
-
174
-
175
-
176
-
177
-
178
-
179
-
180
-
181
-
182
-
183
-
184
-
185
-
186
-
187
-
188
-
189
-
190
-
191
-
192
-
193
-
194
-
195
-
196
-
197
-
198
-
199
-
200
-
201
-
202
-
203
-
204
-
205
-
206
-
207
-
208
-
209
-
210
-
211
-
212
-
213
-
214
-
215
-
216
-
217
-
218
-
219
-
220
-
221
-
222
-
223
-
224
-
225
-
226
-
227
-
228
-
229
-
230
-
231
-
232
-
233
-
234
-
235
-
236
-
237
-
238
-
239
-
240
-
241
-
242
-
243
-
244
-
245
-
246
-
247
-
248
-
249
-
250
-
251
-
252
-
253
-
254
-
255
-
256
-
257
-
258
-
259
-
260
-
261
-
262
-
263
-
264
-
265
-
266
-
267
-
268
-
269
-
270
-
271
-
272
-
273
-
274
-
275
-
276
-
277
-
278
-
279
-
280
-
281
-
282
-
283
-
284
-
285
-
286
-
287
-
288
-
289
-
290
-
291
-
292
-
293
-
294
-
295
-
296
-
297
-
298
-
299
-
300
-
301
-
302
 |
 |

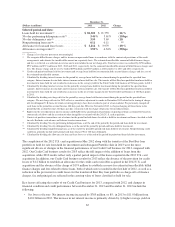
provision for mortgage representation and warranty losses. We recorded a total pre-tax provision for mortgage
representation and warranty losses of $309 million, $349 million and $212 million in 2013, 2012 and 2011,
respectively. The portion of these amounts included in loss from discontinued operations totaled $333 million
($210 million net of tax) in 2013, $307 million ($194 million net of tax) in 2012 and $169 million ($120 million
net of tax) in 2011.
We provide additional information on the provision for mortgage representation and warranty losses and the
related reserve for potential representation and warranty claims in “Consolidated Balance Sheets Analysis—
Potential Mortgage Representation and Warranty Liabilities” and “Note 20—Commitments, Contingencies,
Guarantees, and Others.”
BUSINESS SEGMENT FINANCIAL PERFORMANCE
Our principal operations are currently organized into three major business segments, which are defined based on
the products and services provided or the type of customer served: Credit Card, Consumer Banking and
Commercial Banking. The operations of acquired businesses have been integrated into our existing business
segments. Certain activities that are not part of a segment, such as management of our corporate investment
portfolio and asset/liability management by our centralized Corporate Treasury group, are included in the
“Other” category.
The results of our individual businesses, which we report on a continuing operations basis, reflect the manner in
which management evaluates performance and makes decisions about funding our operations and allocating
resources. Our business segment results are intended to reflect each segment as if it were a stand-alone business.
We use an internal management and reporting process to derive our business segment results. Our internal
management and reporting process employs various allocation methodologies, including funds transfer pricing,
to assign certain balance sheet assets, deposits and other liabilities and their related revenue and expenses directly
or indirectly attributable to each business segment. Total interest income and net fees are directly attributable to
the segment in which they are reported. The net interest income of each segment reflects the results of our funds
transfer pricing process, which is primarily based on a matched maturity method that takes into consideration
market rates. Our funds transfer pricing process provides a funds credit for sources of funds, such as deposits
generated by our Consumer Banking and Commercial Banking businesses, and a funds charge for the use of
funds by each segment. The allocation process is unique to each business segment and acquired businesses.
We may periodically change our business segments or reclassify business segment results based on modifications
to our management reporting methodologies and changes in organizational alignment. In the first quarter of
2012, we re-aligned the loan categories reported by our Commercial Banking business and the loan customer and
product types included within each category. As a result of this re-alignment, we now report three product
categories: commercial and multifamily real estate, commercial and industrial loans and small-ticket commercial
real estate, which is a run-off portfolio. We previously reported four categories within our Commercial Banking
business: commercial and multifamily real estate, middle market, specialty lending and small-ticket commercial
real estate. Middle market and specialty lending related products are included in commercial and industrial loans.
All affordable housing tax-related investments, some of which were previously included in the “Other” segment,
are now included in the commercial and multifamily real estate category of our Commercial Banking business.
Prior period amounts have been recast to conform to the current period presentation.
We refer to the business segment results derived from our internal management accounting and reporting process
as our “managed” presentation, which differs in some cases from our reported results prepared based on U.S.
GAAP. There is no comprehensive, authoritative body of guidance for management accounting equivalent to
U.S. GAAP; therefore, the managed presentation of our business segment results may not be comparable to
similar information provided by other financial service companies. In addition, our individual business segment
results should not be used as a substitute for comparable results determined in accordance with U.S. GAAP.
63