Capital One 2013 Annual Report Download - page 136
Download and view the complete annual report
Please find page 136 of the 2013 Capital One annual report below. You can navigate through the pages in the report by either clicking on the pages listed below, or by using the keyword search tool below to find specific information within the annual report.-
 1
1 -
2
-
3
-
4
-
5
-
6
-
7
-
8
-
9
-
10
-
11
-
12
-
13
-
14
-
15
-
16
-
17
-
18
-
19
-
20
-
21
-
22
-
23
-
24
-
25
-
26
-
27
-
28
-
29
-
30
-
31
-
32
-
33
-
34
-
35
-
36
-
37
-
38
-
39
-
40
-
41
-
42
-
43
-
44
-
45
-
46
-
47
-
48
-
49
-
50
-
51
-
52
-
53
-
54
-
55
-
56
-
57
-
58
-
59
-
60
-
61
-
62
-
63
-
64
-
65
-
66
-
67
-
68
-
69
-
70
-
71
-
72
-
73
-
74
-
75
-
76
-
77
-
78
-
79
-
80
-
81
-
82
-
83
-
84
-
85
-
86
-
87
-
88
-
89
-
90
-
91
-
92
-
93
-
94
-
95
-
96
-
97
-
98
-
99
-
100
-
101
-
102
-
103
-
104
-
105
-
106
-
107
-
108
-
109
-
110
-
111
-
112
-
113
-
114
-
115
-
116
-
117
-
118
-
119
-
120
-
121
-
122
-
123
-
124
-
125
-
 126
126 -
 127
127 -
 128
128 -
 129
129 -
 130
130 -
 131
131 -
 132
132 -
 133
133 -
 134
134 -
 135
135 -
 136
136 -
 137
137 -
 138
138 -
 139
139 -
 140
140 -
 141
141 -
 142
142 -
 143
143 -
 144
144 -
 145
145 -
 146
146 -
147
-
148
-
149
-
150
-
151
-
152
-
153
-
154
-
155
-
156
-
157
-
158
-
159
-
160
-
161
-
162
-
163
-
164
-
165
-
166
-
167
-
168
-
169
-
170
-
171
-
172
-
173
-
174
-
175
-
176
-
177
-
178
-
179
-
180
-
181
-
182
-
183
-
184
-
185
-
186
-
187
-
188
-
189
-
190
-
191
-
192
-
193
-
194
-
195
-
196
-
197
-
198
-
199
-
200
-
201
-
202
-
203
-
204
-
205
-
206
-
207
-
208
-
209
-
210
-
211
-
212
-
213
-
214
-
215
-
216
-
217
-
218
-
219
-
220
-
221
-
222
-
223
-
224
-
225
-
226
-
227
-
228
-
229
-
230
-
231
-
232
-
233
-
234
-
235
-
236
-
237
-
238
-
239
-
240
-
241
-
242
-
243
-
244
-
245
-
246
-
247
-
248
-
249
-
250
-
251
-
252
-
253
-
254
-
255
-
256
-
257
-
258
-
259
-
260
-
261
-
262
-
263
-
264
-
265
-
266
-
267
-
268
-
269
-
270
-
271
-
272
-
273
-
274
-
275
-
276
-
277
-
278
-
279
-
280
-
281
-
282
-
283
-
284
-
285
-
286
-
287
-
288
-
289
-
290
-
291
-
292
-
293
-
294
-
295
-
296
-
297
-
298
-
299
-
300
-
301
-
302
 |
 |

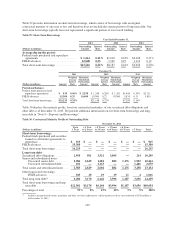
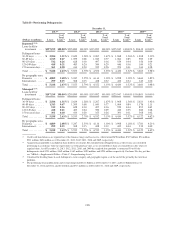
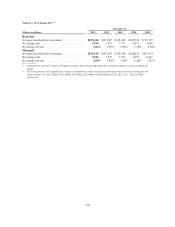
Table B—Performing Delinquencies
December 31,
2013(2) 2012(2) 2011(2) 2010(2) 2009(2)
(Dollars in millions) Loans
% of
Total
Loans(3) Loans
% of
Total
Loans(3) Loans
% of
Total
Loans(3) Loans
% of
Total
Loans(3) Loans
% of
Total
Loans(3)
Reported:(1)(4)
Loans held for
investment ..... $197,199 100.00% $205,889 100.00% $135,892 100.00% $125,947 100.00% $ 90,619 100.00%
Delinquent loans:
30-59 days ....... $ 2,584 1.31% $ 2,629 1.28% $ 2,267 1.67% $ 1,968 1.56% $ 1,908 2.10%
60-89 days ....... 1,313 0.67 1,399 0.68 1,043 0.77 1,064 0.85 985 1.09
90-119 days ...... 512 0.26 628 0.30 497 0.36 559 0.44 356 0.39
120-149 days ..... 418 0.21 485 0.24 390 0.29 446 0.36 190 0.21
150 or more days . . 361 0.18 414 0.20 355 0.26 393 0.31 164 0.18
Total ............ $ 5,188 2.63% $ 5,555 2.70% $ 4,552 3.35% $ 4,430 3.52% $ 3,603 3.98%
By geographic area:
Domestic ........ $ 4,889 2.48% $ 5,247 2.55% $ 4,114 3.03% $ 3,998 3.18% $ 3,460 3.82%
International ...... 299 0.15 308 0.15 438 0.32 432 0.34 143 0.16
Total ............ $ 5,188 2.63% $ 5,555 2.70% $ 4,552 3.35% $ 4,430 3.52% $ 3,603 3.98%
Managed:(1)(4)
Loans held for
investment ..... $197,199 100.00% $205,889 100.00% $135,892 100.00% $125,947 100.00% $136,803 100.00%
Delinquent loans:
30-59 days ....... $ 2,584 1.31% $ 2,629 1.28% $ 2,267 1.67% $ 1,968 1.56% $ 2,623 1.92%
60-89 days ....... 1,313 0.67 1,399 0.68 1,043 0.77 1,064 0.84 1,576 1.15
90-119 days ...... 512 0.26 628 0.30 497 0.36 559 0.44 895 0.65
120-149 days ..... 418 0.21 485 0.24 390 0.29 446 0.35 660 0.48
150 or more days . . 361 0.18 414 0.20 355 0.26 393 0.31 568 0.42
Total ............ $ 5,188 2.63% $ 5,555 2.70% $ 4,552 3.35% $ 4,430 3.52% $ 6,322 4.62%
By geographic area:
Domestic ........ $ 4,889 2.48% $ 5,247 2.55% $ 4,114 3.03% $ 3,998 3.18% $ 5,783 4.23%
International ...... 299 0.15 308 0.15 438 0.32 432 0.34 539 0.39
Total ............ $ 5,188 2.63% $ 5,555 2.70% $ 4,552 3.35% $ 4,430 3.52% $ 6,322 4.62%
(1) Credit card loan balances are reported net of the finance charge and fee reserve, which totaled $190 million, $307 million, $74 million,
$211 million, $624 million as of December 31, 2013, 2012, 2011, 2010 and 2009, respectively.
(2) Acquired Loan portfolio is included in loans held for investment, but excluded from delinquent loans as these loans are considered
performing in accordance with our expectations as of the purchase date, as we recorded these loans at estimated fair value when we
acquired them. As of December 31, 2013, 2012, 2011, 2010, and 2009 the acquired loan portfolio’s contractual 30 to 89 day
delinquencies total $223 million, $369 million, $162, million, $199 million, and $294 million, respectively. For loans 90+ day past due,
see “MD&A—Supplemental Tables—Table C: Nonperforming Assets.”
(3) Calculated by dividing loans in each delinquency status category and geographic region as of the end of the period by the total loan
portfolio.
(4) The performing loan modifications and restructuring totaled $1.3 billion as of December 31, 2013, and $1.4 billion both as of
December 31, 2012 and 2011, and $1.0 billion and $713 million as of December 31, 2010 and 2009, respectively.
116