Capital One 2013 Annual Report Download - page 119
Download and view the complete annual report
Please find page 119 of the 2013 Capital One annual report below. You can navigate through the pages in the report by either clicking on the pages listed below, or by using the keyword search tool below to find specific information within the annual report.-
 1
1 -
2
-
3
-
4
-
5
-
6
-
7
-
8
-
9
-
10
-
11
-
12
-
13
-
14
-
15
-
16
-
17
-
18
-
19
-
20
-
21
-
22
-
23
-
24
-
25
-
26
-
27
-
28
-
29
-
30
-
31
-
32
-
33
-
34
-
35
-
36
-
37
-
38
-
39
-
40
-
41
-
42
-
43
-
44
-
45
-
46
-
47
-
48
-
49
-
50
-
51
-
52
-
53
-
54
-
55
-
56
-
57
-
58
-
59
-
60
-
61
-
62
-
63
-
64
-
65
-
66
-
67
-
68
-
69
-
70
-
71
-
72
-
73
-
74
-
75
-
76
-
77
-
78
-
79
-
80
-
81
-
82
-
83
-
84
-
85
-
86
-
87
-
88
-
89
-
90
-
91
-
92
-
93
-
94
-
95
-
96
-
97
-
98
-
99
-
100
-
101
-
102
-
103
-
104
-
105
-
106
-
107
-
108
-
 109
109 -
 110
110 -
 111
111 -
 112
112 -
 113
113 -
 114
114 -
 115
115 -
 116
116 -
 117
117 -
 118
118 -
 119
119 -
 120
120 -
 121
121 -
 122
122 -
 123
123 -
 124
124 -
 125
125 -
 126
126 -
 127
127 -
 128
128 -
 129
129 -
130
-
131
-
132
-
133
-
134
-
135
-
136
-
137
-
138
-
139
-
140
-
141
-
142
-
143
-
144
-
145
-
146
-
147
-
148
-
149
-
150
-
151
-
152
-
153
-
154
-
155
-
156
-
157
-
158
-
159
-
160
-
161
-
162
-
163
-
164
-
165
-
166
-
167
-
168
-
169
-
170
-
171
-
172
-
173
-
174
-
175
-
176
-
177
-
178
-
179
-
180
-
181
-
182
-
183
-
184
-
185
-
186
-
187
-
188
-
189
-
190
-
191
-
192
-
193
-
194
-
195
-
196
-
197
-
198
-
199
-
200
-
201
-
202
-
203
-
204
-
205
-
206
-
207
-
208
-
209
-
210
-
211
-
212
-
213
-
214
-
215
-
216
-
217
-
218
-
219
-
220
-
221
-
222
-
223
-
224
-
225
-
226
-
227
-
228
-
229
-
230
-
231
-
232
-
233
-
234
-
235
-
236
-
237
-
238
-
239
-
240
-
241
-
242
-
243
-
244
-
245
-
246
-
247
-
248
-
249
-
250
-
251
-
252
-
253
-
254
-
255
-
256
-
257
-
258
-
259
-
260
-
261
-
262
-
263
-
264
-
265
-
266
-
267
-
268
-
269
-
270
-
271
-
272
-
273
-
274
-
275
-
276
-
277
-
278
-
279
-
280
-
281
-
282
-
283
-
284
-
285
-
286
-
287
-
288
-
289
-
290
-
291
-
292
-
293
-
294
-
295
-
296
-
297
-
298
-
299
-
300
-
301
-
302
 |
 |

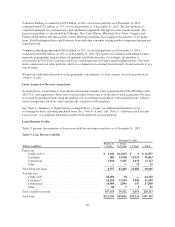
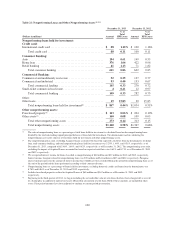
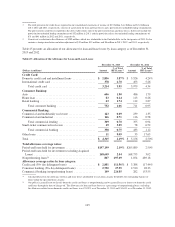
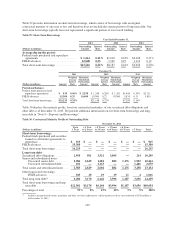
Table 20 summarizes loans that were 90 days or more past due as to interest or principal and still accruing
interest as of December 31, 2013, 2012 and 2011. These loans consist primarily of credit card accounts between
90 days and 179 days past due. As permitted by regulatory guidance issued by the Federal Financial Institutions
Examination Council (“FFIEC”), we generally continue to accrue interest and fees on domestic credit card loans
through the date of charge-off, which is typically in the period the account becomes 180 days past due. While
domestic credit card loans typically remain on accrual status until the loan is charged-off, we reduce the balance
of our credit card receivables by the amount of finance charges and fees billed but not expected to be collected
and exclude this amount from revenue.
Table 20: 90+ Day Delinquent Loans Accruing Interest
(Dollars in millions)
December 31, 2013 December 31, 2012 December 31, 2011
Amount
% of
Total Loans Amount
% of
Total Loans Amount
% of
Total Loans
Loan category:(1)
Credit card ............................ $1,283 1.58% $1,510 1.65% $1,196 1.84%
Consumer ............................. 2— 1 — 5 0.01
Commercial ........................... 6 0.01 16 0.04 41 0.12
Total ............................. $1,291 0.65% $1,527 0.74% $1,242 0.91%
Geographic region:(2)
Domestic .............................. $1,195 0.60% $1,427 0.69% $1,047 0.77%
International ........................... 96 0.05 100 0.05 195 0.14
Total ............................. $1,291 0.65% $1,527 0.74% $1,242 0.91%
(1) Delinquency rates are calculated for each loan category by dividing 90+ day delinquent loans accruing interest by period-end loans held
for investment for the specified loan category, including Acquired Loans accounted for based on estimated cash flows as applicable.
(2) Calculated by dividing loans in each geographic region by total period-end loans held for investment.
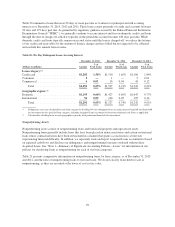
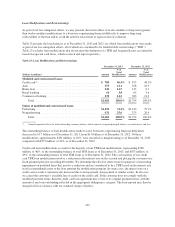
Nonperforming Assets
Nonperforming assets consist of nonperforming loans and foreclosed property and repossessed assets.
Nonperforming loans generally include loans that have been placed on nonaccrual status and certain restructured
loans whose contractual terms have been restructured in a manner that grants a concession to a borrower
experiencing financial difficulty. In addition, we separately track and report Acquired Loans accounted for based
on expected cash flows and disclose our delinquency and nonperforming loan rates with and without these
Acquired Loans. See “Note 1—Summary of Significant Accounting Policies—Loans” for information on our
policies for classifying loans as nonperforming for each of our loan categories.
Table 21 presents comparative information on nonperforming loans, by loan category, as of December 31, 2013
and 2012, and the ratio of nonperforming loans to our total loans. We do not classify loans held for sale as
nonperforming, as they are recorded at the lower of cost or fair value.
99