Capital One 2013 Annual Report Download - page 139
Download and view the complete annual report
Please find page 139 of the 2013 Capital One annual report below. You can navigate through the pages in the report by either clicking on the pages listed below, or by using the keyword search tool below to find specific information within the annual report.-
 1
1 -
2
-
3
-
4
-
5
-
6
-
7
-
8
-
9
-
10
-
11
-
12
-
13
-
14
-
15
-
16
-
17
-
18
-
19
-
20
-
21
-
22
-
23
-
24
-
25
-
26
-
27
-
28
-
29
-
30
-
31
-
32
-
33
-
34
-
35
-
36
-
37
-
38
-
39
-
40
-
41
-
42
-
43
-
44
-
45
-
46
-
47
-
48
-
49
-
50
-
51
-
52
-
53
-
54
-
55
-
56
-
57
-
58
-
59
-
60
-
61
-
62
-
63
-
64
-
65
-
66
-
67
-
68
-
69
-
70
-
71
-
72
-
73
-
74
-
75
-
76
-
77
-
78
-
79
-
80
-
81
-
82
-
83
-
84
-
85
-
86
-
87
-
88
-
89
-
90
-
91
-
92
-
93
-
94
-
95
-
96
-
97
-
98
-
99
-
100
-
101
-
102
-
103
-
104
-
105
-
106
-
107
-
108
-
109
-
110
-
111
-
112
-
113
-
114
-
115
-
116
-
117
-
118
-
119
-
120
-
121
-
122
-
123
-
124
-
125
-
126
-
127
-
128
-
 129
129 -
 130
130 -
 131
131 -
 132
132 -
 133
133 -
 134
134 -
 135
135 -
 136
136 -
 137
137 -
 138
138 -
 139
139 -
 140
140 -
 141
141 -
 142
142 -
 143
143 -
 144
144 -
 145
145 -
 146
146 -
 147
147 -
 148
148 -
 149
149 -
150
-
151
-
152
-
153
-
154
-
155
-
156
-
157
-
158
-
159
-
160
-
161
-
162
-
163
-
164
-
165
-
166
-
167
-
168
-
169
-
170
-
171
-
172
-
173
-
174
-
175
-
176
-
177
-
178
-
179
-
180
-
181
-
182
-
183
-
184
-
185
-
186
-
187
-
188
-
189
-
190
-
191
-
192
-
193
-
194
-
195
-
196
-
197
-
198
-
199
-
200
-
201
-
202
-
203
-
204
-
205
-
206
-
207
-
208
-
209
-
210
-
211
-
212
-
213
-
214
-
215
-
216
-
217
-
218
-
219
-
220
-
221
-
222
-
223
-
224
-
225
-
226
-
227
-
228
-
229
-
230
-
231
-
232
-
233
-
234
-
235
-
236
-
237
-
238
-
239
-
240
-
241
-
242
-
243
-
244
-
245
-
246
-
247
-
248
-
249
-
250
-
251
-
252
-
253
-
254
-
255
-
256
-
257
-
258
-
259
-
260
-
261
-
262
-
263
-
264
-
265
-
266
-
267
-
268
-
269
-
270
-
271
-
272
-
273
-
274
-
275
-
276
-
277
-
278
-
279
-
280
-
281
-
282
-
283
-
284
-
285
-
286
-
287
-
288
-
289
-
290
-
291
-
292
-
293
-
294
-
295
-
296
-
297
-
298
-
299
-
300
-
301
-
302
 |
 |

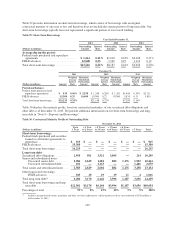
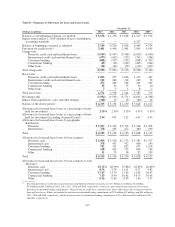
Table E—Summary of Allowance for Loan and Lease Losses
December 31,
(Dollars in millions) 2013 2012 2011 2010 2009
Balance as of beginning of period, as reported. ........... $ 5,156 $ 4,250 $ 5,628 $ 4,127 $ 4,524
Impact from January 1, 2010 adoption of new consolidation
accounting standards .............................. —— — 4,317 —
Balance at beginning of period, as adjusted .............. 5,156 4,250 5,628 8,444 4,524
Provision for credit losses(1) .......................... 3,401 4,446 2,401 3,895 4,145
Charge-offs:
Domestic credit card and installment loans .......... (3,969) (3,507) (3,558) (6,020) (3,050)
International credit card and installment loans ........ (573) (652) (752) (761) (284)
Consumer banking .............................. (888) (797) (732) (898) (1,357)
Commercial banking ............................ (49) (94) (214) (445) (444)
Other loans ................................... (26) (43) (59) (114) (207)
Total charge-offs ................................... (5,505) (5,093) (5,315) (8,238) (5,342)
Recoveries:
Domestic credit card and installment loans .......... 1,065 975 1,036 1,113 447
International credit card and installment loans ........ 192 240 218 169 52
Consumer banking .............................. 272 266 248 243 263
Commercial banking ............................ 35 52 37 54 10
Other loans ................................... 75582
Total recoveries. ................................... 1,571 1,538 1,544 1,587 774
Net charge-offs .................................... (3,934) (3,555) (3,771) (6,651) (4,568)
Impact from acquisitions, sales and other changes ......... (308) 15 (8) (60) 26
Balance at the end of period .......................... $ 4,315 $ 5,156 $ 4,250 $ 5,628 $ 4,127
Allowance for loan and lease losses as a percentage of loans
held for investment ............................... 2.19% 2.50% 3.13% 4.47% 4.55%
Allowance for loan and lease losses as a percentage of loans
held for investment (excluding Acquired Loans) ........ 2.54 3.02 3.22 4.67 4.95
Allowance for loan and lease losses by geographic
distribution:
Domestic ..................................... $ 3,937 $ 4,703 $ 3,778 $ 5,168 $ 3,928
International. .................................. 378 453 472 460 199
Total ............................................ $ 4,315 $ 5,156 $ 4,250 $ 5,628 $ 4,127
Allowance for loan and lease losses by loan category:
Domestic card ................................. $ 2,836 $ 3,526 $ 2,375 $ 3,581 $ 1,927
International card ............................... 378 453 472 460 199
Consumer banking .............................. 752 711 652 675 1,076
Commercial banking ............................ 338 433 715 830 786
Other ........................................ 11 33 36 82 139
Total ............................................ $ 4,315 $ 5,156 $ 4,250 $ 5,628 $ 4,127
Allowance for loan and lease losses by loan category to total
allowance:
Domestic card ................................. 65.72% 68.39% 55.88% 63.63% 46.69%
International card ............................... 8.76 8.78 11.11 8.17 4.82
Consumer banking .............................. 17.43 13.79 15.34 11.99 26.07
Commercial banking ............................ 7.83 8.40 16.82 14.75 19.05
Other ........................................ 0.26 0.64 0.85 1.46 3.37
(1) The total provision for credit losses reported in our consolidated statements of income are $3.5 billion, $4.4 billion, $2.4 billion,
$3.9 billion and $4.2 billion in 2013, 2012, 2011, 2010 and 2009, respectively, consists of a provision for loan and lease losses and a
provision for unfunded lending commitments. The provision for credit losses reported in the above table relates only to the provision for
loan and lease losses. It does not include the provision for unfunded lending commitments of $52 million, $12 million, and $85 million in
2013, 2010 and 2009, respectively, and the provision release for unfunded lending commitments of $31 million and $41 million in 2012
and 2011, respectively.
119