Capital One 2013 Annual Report Download - page 15
Download and view the complete annual report
Please find page 15 of the 2013 Capital One annual report below. You can navigate through the pages in the report by either clicking on the pages listed below, or by using the keyword search tool below to find specific information within the annual report.-
 1
1 -
2
-
3
-
4
-
 5
5 -
 6
6 -
 7
7 -
 8
8 -
 9
9 -
 10
10 -
 11
11 -
 12
12 -
 13
13 -
 14
14 -
 15
15 -
 16
16 -
 17
17 -
 18
18 -
 19
19 -
 20
20 -
 21
21 -
 22
22 -
 23
23 -
 24
24 -
 25
25 -
26
-
27
-
28
-
29
-
30
-
31
-
32
-
33
-
34
-
35
-
36
-
37
-
38
-
39
-
40
-
41
-
42
-
43
-
44
-
45
-
46
-
47
-
48
-
49
-
50
-
51
-
52
-
53
-
54
-
55
-
56
-
57
-
58
-
59
-
60
-
61
-
62
-
63
-
64
-
65
-
66
-
67
-
68
-
69
-
70
-
71
-
72
-
73
-
74
-
75
-
76
-
77
-
78
-
79
-
80
-
81
-
82
-
83
-
84
-
85
-
86
-
87
-
88
-
89
-
90
-
91
-
92
-
93
-
94
-
95
-
96
-
97
-
98
-
99
-
100
-
101
-
102
-
103
-
104
-
105
-
106
-
107
-
108
-
109
-
110
-
111
-
112
-
113
-
114
-
115
-
116
-
117
-
118
-
119
-
120
-
121
-
122
-
123
-
124
-
125
-
126
-
127
-
128
-
129
-
130
-
131
-
132
-
133
-
134
-
135
-
136
-
137
-
138
-
139
-
140
-
141
-
142
-
143
-
144
-
145
-
146
-
147
-
148
-
149
-
150
-
151
-
152
-
153
-
154
-
155
-
156
-
157
-
158
-
159
-
160
-
161
-
162
-
163
-
164
-
165
-
166
-
167
-
168
-
169
-
170
-
171
-
172
-
173
-
174
-
175
-
176
-
177
-
178
-
179
-
180
-
181
-
182
-
183
-
184
-
185
-
186
-
187
-
188
-
189
-
190
-
191
-
192
-
193
-
194
-
195
-
196
-
197
-
198
-
199
-
200
-
201
-
202
-
203
-
204
-
205
-
206
-
207
-
208
-
209
-
210
-
211
-
212
-
213
-
214
-
215
-
216
-
217
-
218
-
219
-
220
-
221
-
222
-
223
-
224
-
225
-
226
-
227
-
228
-
229
-
230
-
231
-
232
-
233
-
234
-
235
-
236
-
237
-
238
-
239
-
240
-
241
-
242
-
243
-
244
-
245
-
246
-
247
-
248
-
249
-
250
-
251
-
252
-
253
-
254
-
255
-
256
-
257
-
258
-
259
-
260
-
261
-
262
-
263
-
264
-
265
-
266
-
267
-
268
-
269
-
270
-
271
-
272
-
273
-
274
-
275
-
276
-
277
-
278
-
279
-
280
-
281
-
282
-
283
-
284
-
285
-
286
-
287
-
288
-
289
-
290
-
291
-
292
-
293
-
294
-
295
-
296
-
297
-
298
-
299
-
300
-
301
-
302
 |
 |

13
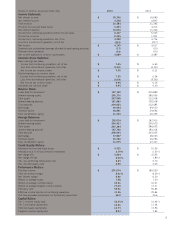
Dollars in millions, except per share data 2013 2012
Income Statement:
Net interest income $ 18,106 $ 16,589
Non-interest income 4,278 4,807
Total revenue 22,384 21,396
Provision for loan and lease losses 3,453 4,415
Non-interest expense 12,514 11,946
Income from continuing operations before income taxes 6,417 5,035
Income tax provision 2,025 1,301
Income from continuing operations, net of tax 4,392 3,734
Loss from discontinued operations, net of tax (233) (217)
Net income $ 4,159 $ 3,517
Dividends and undistributed earnings allocated to participating securities (17) (15)
Preferred stock dividends (53) (15)
Net income available to common stockholders $ 4,089 $ 3,487
Common Share Statistics:
Basic earnings per share:
Income from continuing operations, net of tax $ 7.45 $ 6.60
Loss from discontinued operations, net of tax (0.40) (0.39)
Net income per common share $ 7.05 $ 6.21
Diluted earnings per common share:
Income from continuing operations, net of tax $ 7.35 $ 6.54
Loss from discontinued operations, net of tax (0.39) (0.38)
Net income per common share $ 6.96 $ 6.16
Dividends per common share $ 0.95 $ 0.20
Balance Sheet:
Loans held for investment $ 197,199 $ 205,889
Interest-earning assets 265,170 280,096
Total assets 297,048 312,918
Interest-bearing deposits 181,880 190,018
Total deposits 204,523 212,485
Borrowings 40,654 49,910
Common equity 40,891 39,646
Total stockholders’ equity 41,744 40,499
Average Balances:
Loans held for investment $ 192,614 $ 187,915
Interest-earning assets 266,423 255,079
Total assets 297,284 286,602
Interest-bearing deposits 187,700 183,314
Total deposits 209,045 203,055
Borrowings 37,807 38,025
Common equity 40,722 36,996
Total stockholders’ equity 41,575 37,327
Credit Quality Metrics:
Allowance for loan and lease losses $ 4,315 $ 5,156
Allowance as a % of loans held for investment 2.19 % 2.50 %
Net charge-offs $ 3,934 $ 3,555
Net charge-off rate 2.04 % 1.89 %
30+ day performing delinquency rate 2.63 2.70
30+ day delinquency rate 2.96 3.09
Performance Metrics:
Purchase volume $ 201,074 $ 180,599
Total net revenue margin 8.40 % 8.39 %
Net interest margin 6.80 6.50
Return on average assets 1.48 1.30
Return on average common equity 10.61 10.01
Return on average tangible common equity 17.44 17.31
Efficiency ratio 55.91 55.83
Effective income tax rate on continuing operations 31.56 25.84
Full-time equivalent employees (in thousands), period end 42.0 39.6
Capital Ratios:
Tier 1 common equity ratio 12.23 % 10.96 %
Tier 1 risk-based capital ratio 12.61 11.34
Total risk-based capital ratio 14.73 13.56
Tangible common equity ratio 8.93 7.89