Capital One 2013 Annual Report Download - page 127
Download and view the complete annual report
Please find page 127 of the 2013 Capital One annual report below. You can navigate through the pages in the report by either clicking on the pages listed below, or by using the keyword search tool below to find specific information within the annual report.-
 1
1 -
2
-
3
-
4
-
5
-
6
-
7
-
8
-
9
-
10
-
11
-
12
-
13
-
14
-
15
-
16
-
17
-
18
-
19
-
20
-
21
-
22
-
23
-
24
-
25
-
26
-
27
-
28
-
29
-
30
-
31
-
32
-
33
-
34
-
35
-
36
-
37
-
38
-
39
-
40
-
41
-
42
-
43
-
44
-
45
-
46
-
47
-
48
-
49
-
50
-
51
-
52
-
53
-
54
-
55
-
56
-
57
-
58
-
59
-
60
-
61
-
62
-
63
-
64
-
65
-
66
-
67
-
68
-
69
-
70
-
71
-
72
-
73
-
74
-
75
-
76
-
77
-
78
-
79
-
80
-
81
-
82
-
83
-
84
-
85
-
86
-
87
-
88
-
89
-
90
-
91
-
92
-
93
-
94
-
95
-
96
-
97
-
98
-
99
-
100
-
101
-
102
-
103
-
104
-
105
-
106
-
107
-
108
-
109
-
110
-
111
-
112
-
113
-
114
-
115
-
116
-
 117
117 -
 118
118 -
 119
119 -
 120
120 -
 121
121 -
 122
122 -
 123
123 -
 124
124 -
 125
125 -
 126
126 -
 127
127 -
 128
128 -
 129
129 -
 130
130 -
 131
131 -
 132
132 -
 133
133 -
 134
134 -
 135
135 -
 136
136 -
 137
137 -
138
-
139
-
140
-
141
-
142
-
143
-
144
-
145
-
146
-
147
-
148
-
149
-
150
-
151
-
152
-
153
-
154
-
155
-
156
-
157
-
158
-
159
-
160
-
161
-
162
-
163
-
164
-
165
-
166
-
167
-
168
-
169
-
170
-
171
-
172
-
173
-
174
-
175
-
176
-
177
-
178
-
179
-
180
-
181
-
182
-
183
-
184
-
185
-
186
-
187
-
188
-
189
-
190
-
191
-
192
-
193
-
194
-
195
-
196
-
197
-
198
-
199
-
200
-
201
-
202
-
203
-
204
-
205
-
206
-
207
-
208
-
209
-
210
-
211
-
212
-
213
-
214
-
215
-
216
-
217
-
218
-
219
-
220
-
221
-
222
-
223
-
224
-
225
-
226
-
227
-
228
-
229
-
230
-
231
-
232
-
233
-
234
-
235
-
236
-
237
-
238
-
239
-
240
-
241
-
242
-
243
-
244
-
245
-
246
-
247
-
248
-
249
-
250
-
251
-
252
-
253
-
254
-
255
-
256
-
257
-
258
-
259
-
260
-
261
-
262
-
263
-
264
-
265
-
266
-
267
-
268
-
269
-
270
-
271
-
272
-
273
-
274
-
275
-
276
-
277
-
278
-
279
-
280
-
281
-
282
-
283
-
284
-
285
-
286
-
287
-
288
-
289
-
290
-
291
-
292
-
293
-
294
-
295
-
296
-
297
-
298
-
299
-
300
-
301
-
302
 |
 |

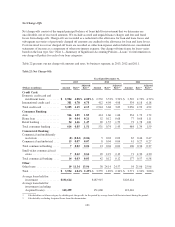
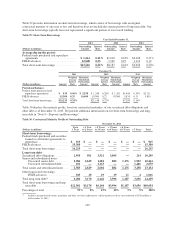
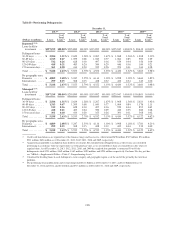
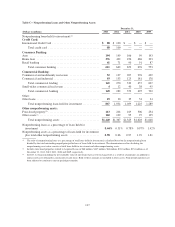
Table 27: Deposit Composition and Average Deposit Rates
December 31, 2013
(Dollars in millions)
Period End
Balance
Average
Balance
Interest
Expense
% of
Average
Deposits
Average
Deposit
Rate
Non-interest bearing ............................... $ 22,643 $ 21,345 N/A 10.2% N/A
Negotiable order of withdrawal (“NOW”) accounts ...... 43,880 43,823 $ 254 21.0 0.58%
Money market deposit accounts ...................... 98,403 101,848 648 48.6 0.64
Savings accounts .................................. 29,264 27,525 66 13.2 0.24
Consumer time deposits less than $100,000 ............. 6,299 8,955 161 4.3 1.80
Total core deposits ............................ 200,489 203,496 1,129 97.3 0.55
Certificates of deposit of $100,000 or more ............. 2,852 3,938 108 1.9 2.74
Foreign time deposits .............................. 1,182 1,611 4 0.8 0.25
Total customer deposits ........................ $204,523 $209,045 $1,241 100.0% 0.59%
December 31, 2012
(Dollars in millions)
Period End
Balance
Average
Balance
Interest
Expense
% of
Average
Deposits
Average
Deposit
Rate
Non-interest bearing ............................... $ 22,467 $ 19,741 N/A 9.7% N/A
Negotiable order of withdrawal (“NOW”) accounts ...... 40,591 34,179 $ 212 16.8 0.62%
Money market deposit accounts ...................... 104,540 99,734 684 49.1 0.69
Savings accounts .................................. 28,285 30,457 101 15.0 0.33
Consumer time deposits less than $100,000 ............. 11,028 12,762 258 6.4 2.02
Total core deposits ............................ 206,911 196,873 1,255 97.0 0.64
Certificates of deposit of $100,000 or more ............. 4,495 4,876 144 2.4 2.95
Foreign time deposits .............................. 1,079 1,305 4 0.6 0.31
Total customer deposits ........................ $212,485 $203,054 $1,403 100.0% 0.69%
December 31, 2011
(Dollars in millions)
Period End
Balance
Average
Balance
Interest
Expense
% of
Average
Deposits
Average
Deposit
Rate
Non-interest bearing ............................... $ 18,281 $ 17,051 N/A 13.5% N/A
Negotiable order of withdrawal (“NOW”) accounts ...... 15,038 13,285 $ 41 10.5 0.31%
Money market deposit accounts ...................... 46,496 46,455 396 36.6 0.85
Savings accounts .................................. 31,433 29,640 218 23.4 0.74
Consumer time deposits less than $100,000 ............. 11,471 13,855 351 10.9 2.53
Total core deposits ............................ 122,719 120,286 1,006 94.9 0.84
Certificates of deposit of $100,000 or more ............. 4,586 5,634 177 4.5 3.14
Foreign time deposits .............................. 921 774 4 0.6 0.52
Total customer deposits ........................ $128,226 $126,694 $1,187 100.0% 0.94%
107