Capital One 2013 Annual Report Download - page 84
Download and view the complete annual report
Please find page 84 of the 2013 Capital One annual report below. You can navigate through the pages in the report by either clicking on the pages listed below, or by using the keyword search tool below to find specific information within the annual report.-
 1
1 -
2
-
3
-
4
-
5
-
6
-
7
-
8
-
9
-
10
-
11
-
12
-
13
-
14
-
15
-
16
-
17
-
18
-
19
-
20
-
21
-
22
-
23
-
24
-
25
-
26
-
27
-
28
-
29
-
30
-
31
-
32
-
33
-
34
-
35
-
36
-
37
-
38
-
39
-
40
-
41
-
42
-
43
-
44
-
45
-
46
-
47
-
48
-
49
-
50
-
51
-
52
-
53
-
54
-
55
-
56
-
57
-
58
-
59
-
60
-
61
-
62
-
63
-
64
-
65
-
66
-
67
-
68
-
69
-
70
-
71
-
72
-
73
-
 74
74 -
 75
75 -
 76
76 -
 77
77 -
 78
78 -
 79
79 -
 80
80 -
 81
81 -
 82
82 -
 83
83 -
 84
84 -
 85
85 -
 86
86 -
 87
87 -
 88
88 -
 89
89 -
 90
90 -
 91
91 -
 92
92 -
 93
93 -
 94
94 -
95
-
96
-
97
-
98
-
99
-
100
-
101
-
102
-
103
-
104
-
105
-
106
-
107
-
108
-
109
-
110
-
111
-
112
-
113
-
114
-
115
-
116
-
117
-
118
-
119
-
120
-
121
-
122
-
123
-
124
-
125
-
126
-
127
-
128
-
129
-
130
-
131
-
132
-
133
-
134
-
135
-
136
-
137
-
138
-
139
-
140
-
141
-
142
-
143
-
144
-
145
-
146
-
147
-
148
-
149
-
150
-
151
-
152
-
153
-
154
-
155
-
156
-
157
-
158
-
159
-
160
-
161
-
162
-
163
-
164
-
165
-
166
-
167
-
168
-
169
-
170
-
171
-
172
-
173
-
174
-
175
-
176
-
177
-
178
-
179
-
180
-
181
-
182
-
183
-
184
-
185
-
186
-
187
-
188
-
189
-
190
-
191
-
192
-
193
-
194
-
195
-
196
-
197
-
198
-
199
-
200
-
201
-
202
-
203
-
204
-
205
-
206
-
207
-
208
-
209
-
210
-
211
-
212
-
213
-
214
-
215
-
216
-
217
-
218
-
219
-
220
-
221
-
222
-
223
-
224
-
225
-
226
-
227
-
228
-
229
-
230
-
231
-
232
-
233
-
234
-
235
-
236
-
237
-
238
-
239
-
240
-
241
-
242
-
243
-
244
-
245
-
246
-
247
-
248
-
249
-
250
-
251
-
252
-
253
-
254
-
255
-
256
-
257
-
258
-
259
-
260
-
261
-
262
-
263
-
264
-
265
-
266
-
267
-
268
-
269
-
270
-
271
-
272
-
273
-
274
-
275
-
276
-
277
-
278
-
279
-
280
-
281
-
282
-
283
-
284
-
285
-
286
-
287
-
288
-
289
-
290
-
291
-
292
-
293
-
294
-
295
-
296
-
297
-
298
-
299
-
300
-
301
-
302
 |
 |

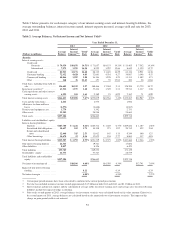
Below we summarize our business segment results for 2013, 2012 and 2011 and provide a comparative
discussion of these results. We also discuss changes in our financial condition and credit performance statistics as
of December 31, 2013, compared with December 31, 2012. We provide additional information on the allocation
methodologies used to derive our business segment results and a reconciliation of our total business segment
results to our reported consolidated results in “Note 19—Business Segments.” We provide information on the
outlook for each of our business segments is presented above under “Executive Summary and Business
Outlook.”
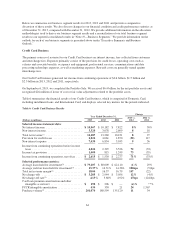
Credit Card Business
The primary sources of revenue for our Credit Card business are interest income, fees collected from customers
and interchange fees. Expenses primarily consist of the provision for credit losses, operating costs such as
salaries and associate benefits, occupancy and equipment, professional services, communications and data
processing technology expenses, as well as marketing expenses. Rewards costs are generally netted against
interchange fees.
Our Credit Card business generated net income from continuing operations of $2.6 billion, $1.5 billion and
$2.3 billion in 2013, 2012 and 2011, respectively.
On September 6, 2013, we completed the Portfolio Sale. We received $6.4 billion for the net portfolio assets and
recognized $26 million of lower of cost or fair value adjustments related to the portfolio assets.
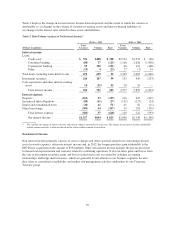
Table 6 summarizes the financial results of our Credit Card business, which is comprised of Domestic Card,
including installment loans, and International Card, and displays selected key metrics for the periods indicated.
Table 6: Credit Card Business Results
(Dollars in millions)
Year Ended December 31,
Change
2013 vs.
2012
2012 vs.
20112013 2012 2011
Selected income statement data:
Net interest income ......................... $ 10,967 $ 10,182 $ 7,822 8% 30%
Non-interest income ......................... 3,320 3,078 2,609 818
Total net revenue(1) ......................... 14,287 13,260 10,431 827
Provision for credit losses .................... 2,824 4,061 1,870 (30) 117
Non-interest expense ........................ 7,439 6,854 5,035 936
Income from continuing operations before income
taxes ................................... 4,024 2,345 3,526 72 (33)
Income tax provision ........................ 1,409 815 1,249 73 (35)
Income from continuing operations, net of tax .... $ 2,615 $ 1,530 $ 2,277 71% (33)%
Selected performance metrics:
Average loans held for investment(2) ............ $ 79,207 $ 80,009 $ 62,110 (1)% 29%
Average yield on loans held for investment(3) ..... 15.37% 14.31% 14.36% 106bps (5)bps
Total net revenue margin(4) ................... 18.04 16.57 16.79 147 (22)
Net charge-offs ............................ $ 3,285 $ 2,944 $ 3,056 12% (4)%
Net charge-off rate(5) ........................ 4.15% 3.68% 4.92% 47bps (124)bps
Card loan premium amortization and other
intangible accretion(6) ...................... $ 198 $ 206 $ — (4)% **%
PCCR intangible amortization ................. 434 350 21 24 1,567
Purchase volume(7) .......................... 201,074 180,599 135,120 11 34
64