Capital One 2013 Annual Report Download - page 262
Download and view the complete annual report
Please find page 262 of the 2013 Capital One annual report below. You can navigate through the pages in the report by either clicking on the pages listed below, or by using the keyword search tool below to find specific information within the annual report.-
 1
1 -
2
-
3
-
4
-
5
-
6
-
7
-
8
-
9
-
10
-
11
-
12
-
13
-
14
-
15
-
16
-
17
-
18
-
19
-
20
-
21
-
22
-
23
-
24
-
25
-
26
-
27
-
28
-
29
-
30
-
31
-
32
-
33
-
34
-
35
-
36
-
37
-
38
-
39
-
40
-
41
-
42
-
43
-
44
-
45
-
46
-
47
-
48
-
49
-
50
-
51
-
52
-
53
-
54
-
55
-
56
-
57
-
58
-
59
-
60
-
61
-
62
-
63
-
64
-
65
-
66
-
67
-
68
-
69
-
70
-
71
-
72
-
73
-
74
-
75
-
76
-
77
-
78
-
79
-
80
-
81
-
82
-
83
-
84
-
85
-
86
-
87
-
88
-
89
-
90
-
91
-
92
-
93
-
94
-
95
-
96
-
97
-
98
-
99
-
100
-
101
-
102
-
103
-
104
-
105
-
106
-
107
-
108
-
109
-
110
-
111
-
112
-
113
-
114
-
115
-
116
-
117
-
118
-
119
-
120
-
121
-
122
-
123
-
124
-
125
-
126
-
127
-
128
-
129
-
130
-
131
-
132
-
133
-
134
-
135
-
136
-
137
-
138
-
139
-
140
-
141
-
142
-
143
-
144
-
145
-
146
-
147
-
148
-
149
-
150
-
151
-
152
-
153
-
154
-
155
-
156
-
157
-
158
-
159
-
160
-
161
-
162
-
163
-
164
-
165
-
166
-
167
-
168
-
169
-
170
-
171
-
172
-
173
-
174
-
175
-
176
-
177
-
178
-
179
-
180
-
181
-
182
-
183
-
184
-
185
-
186
-
187
-
188
-
189
-
190
-
191
-
192
-
193
-
194
-
195
-
196
-
197
-
198
-
199
-
200
-
201
-
202
-
203
-
204
-
205
-
206
-
207
-
208
-
209
-
210
-
211
-
212
-
213
-
214
-
215
-
216
-
217
-
218
-
219
-
220
-
221
-
222
-
223
-
224
-
225
-
226
-
227
-
228
-
229
-
230
-
231
-
232
-
233
-
234
-
235
-
236
-
237
-
238
-
239
-
240
-
241
-
242
-
243
-
244
-
245
-
246
-
247
-
248
-
249
-
250
-
251
-
 252
252 -
 253
253 -
 254
254 -
 255
255 -
 256
256 -
 257
257 -
 258
258 -
 259
259 -
 260
260 -
 261
261 -
 262
262 -
 263
263 -
 264
264 -
 265
265 -
 266
266 -
 267
267 -
 268
268 -
 269
269 -
 270
270 -
 271
271 -
 272
272 -
273
-
274
-
275
-
276
-
277
-
278
-
279
-
280
-
281
-
282
-
283
-
284
-
285
-
286
-
287
-
288
-
289
-
290
-
291
-
292
-
293
-
294
-
295
-
296
-
297
-
298
-
299
-
300
-
301
-
302
 |
 |
CAPITAL ONE FINANCIAL CORPORATION
NOTES TO CONSOLIDATED FINANCIAL STATEMENTS—(Continued)
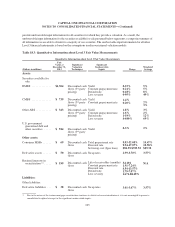
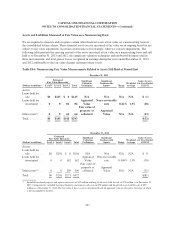
incorporates assumptions that market participants use in estimating future net servicing income, including
estimates of prepayment speeds, discount rate, cost to service, contractual servicing fee income, ancillary income
and late fees. Fair value measurements of MSRs use significant unobservable inputs and, accordingly, are
classified as Level 3. In the event we enter into an agreement with a third party to sell the MSRs, the valuation is
based on the agreed upon sale price which is considered to be the determined exit price for the assets and the
MSRs are classified as Level 2.
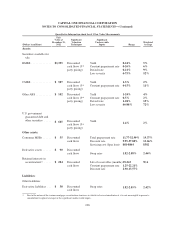
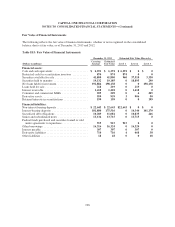
Retained Interest in Securitizations
We have retained interest in various mortgage securitization deals from previous acquisitions. Our retained
interest include rights to future cash flows arising from the receivables, the most significant being certificated
interest-only bonds issued by the trust. We record our interest in these deals at fair value using valuation models
to calculate the present value of future income. The model incorporates various assumptions that market
participants use in estimating future income including weighted average life, constant prepayment rate, discount
rate, default rate and severity.
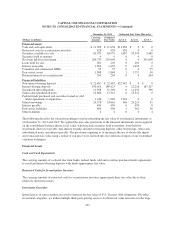
Foreclosed property and Other Assets
Foreclosed property and other repossessed assets are carried at the lower of the carrying amount or fair value less
costs to sell. Due to the use of significant unobservable inputs, foreclosed property is classified as Level 3 under
the fair value hierarchy. Fair value adjustments for foreclosed property are recorded in other non-interest expense
in the consolidated statement of income. Foreclosed property and repossessed assets, which we report in our
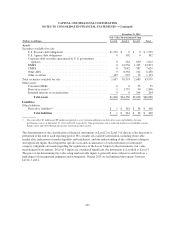
consolidated balance sheets under other assets, totaled $113 million and $160 million, respectively, as of
December 31, 2013, compared with $204 million and $109 million, respectively, as of December 31, 2012.
Long-lived assets held for sale are also subject to fair value measurement on a nonrecurring basis, and carried at
the lower of their carrying amount or fair value less costs to sell. Due to the use of unobservable inputs, long-
lived assets held for sale are classified as Level 3 under the fair value hierarchy. Fair value adjustments for other
assets are recorded in other non-interest expense in the consolidated statement of income.
Financial Liabilities
Non-Interest Bearing Deposits
The carrying amount of non-interest bearing deposits approximates fair value.
Interest-Bearing Deposits
The fair value of interest-bearing deposits was determined based on discounted expected cash flows using
discount rates consistent with current market rates for similar products with similar remaining terms.
Securitized Debt Obligations
We utilized multiple third party pricing services to obtain fair value measures for the large majority of our
securitized debt obligations. The techniques used by the pricing services utilize observable market data to the
extent available; and pricing models may be used which incorporate available trade, bid and other market
information as described in the above section. We used internal pricing models, discounted cash flow models or
similar techniques to estimate the fair value of certain securitization trusts where third-party pricing was not
available.
242