Capital One 2013 Annual Report Download - page 128
Download and view the complete annual report
Please find page 128 of the 2013 Capital One annual report below. You can navigate through the pages in the report by either clicking on the pages listed below, or by using the keyword search tool below to find specific information within the annual report.-
 1
1 -
2
-
3
-
4
-
5
-
6
-
7
-
8
-
9
-
10
-
11
-
12
-
13
-
14
-
15
-
16
-
17
-
18
-
19
-
20
-
21
-
22
-
23
-
24
-
25
-
26
-
27
-
28
-
29
-
30
-
31
-
32
-
33
-
34
-
35
-
36
-
37
-
38
-
39
-
40
-
41
-
42
-
43
-
44
-
45
-
46
-
47
-
48
-
49
-
50
-
51
-
52
-
53
-
54
-
55
-
56
-
57
-
58
-
59
-
60
-
61
-
62
-
63
-
64
-
65
-
66
-
67
-
68
-
69
-
70
-
71
-
72
-
73
-
74
-
75
-
76
-
77
-
78
-
79
-
80
-
81
-
82
-
83
-
84
-
85
-
86
-
87
-
88
-
89
-
90
-
91
-
92
-
93
-
94
-
95
-
96
-
97
-
98
-
99
-
100
-
101
-
102
-
103
-
104
-
105
-
106
-
107
-
108
-
109
-
110
-
111
-
112
-
113
-
114
-
115
-
116
-
117
-
 118
118 -
 119
119 -
 120
120 -
 121
121 -
 122
122 -
 123
123 -
 124
124 -
 125
125 -
 126
126 -
 127
127 -
 128
128 -
 129
129 -
 130
130 -
 131
131 -
 132
132 -
 133
133 -
 134
134 -
 135
135 -
 136
136 -
 137
137 -
 138
138 -
139
-
140
-
141
-
142
-
143
-
144
-
145
-
146
-
147
-
148
-
149
-
150
-
151
-
152
-
153
-
154
-
155
-
156
-
157
-
158
-
159
-
160
-
161
-
162
-
163
-
164
-
165
-
166
-
167
-
168
-
169
-
170
-
171
-
172
-
173
-
174
-
175
-
176
-
177
-
178
-
179
-
180
-
181
-
182
-
183
-
184
-
185
-
186
-
187
-
188
-
189
-
190
-
191
-
192
-
193
-
194
-
195
-
196
-
197
-
198
-
199
-
200
-
201
-
202
-
203
-
204
-
205
-
206
-
207
-
208
-
209
-
210
-
211
-
212
-
213
-
214
-
215
-
216
-
217
-
218
-
219
-
220
-
221
-
222
-
223
-
224
-
225
-
226
-
227
-
228
-
229
-
230
-
231
-
232
-
233
-
234
-
235
-
236
-
237
-
238
-
239
-
240
-
241
-
242
-
243
-
244
-
245
-
246
-
247
-
248
-
249
-
250
-
251
-
252
-
253
-
254
-
255
-
256
-
257
-
258
-
259
-
260
-
261
-
262
-
263
-
264
-
265
-
266
-
267
-
268
-
269
-
270
-
271
-
272
-
273
-
274
-
275
-
276
-
277
-
278
-
279
-
280
-
281
-
282
-
283
-
284
-
285
-
286
-
287
-
288
-
289
-
290
-
291
-
292
-
293
-
294
-
295
-
296
-
297
-
298
-
299
-
300
-
301
-
302
 |
 |

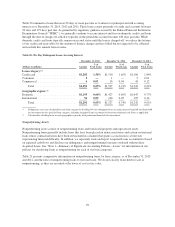
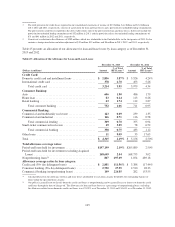
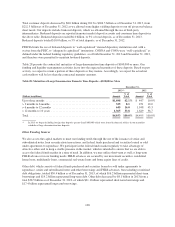
Total customer deposits decreased by $8.0 billion during 2013 to $204.5 billion as of December 31, 2013, from
$212.5 billion as of December 31, 2012 as we allowed some higher yielding deposits to run off given our balance
sheet needs. Our deposits include brokered deposits, which we obtained through the use of third-party
intermediaries. Brokered deposits are reported in money market deposit accounts and consumer time deposits in
the above table. Brokered deposits totaled $6.0 billion, or 3% of total deposits, as of December 31, 2013.
Brokered deposits totaled $10.0 billion, or 5% of total deposits, as of December 31, 2012.
FDICIA limits the use of brokered deposits to “well-capitalized” insured depository institutions and, with a
waiver from the FDIC, to “adequately capitalized” institutions. COBNA and CONA were “well-capitalized,” as
defined under the federal banking regulatory guidelines, as of both December 31, 2013 and December 31, 2012,
and therefore were permitted to maintain brokered deposits.
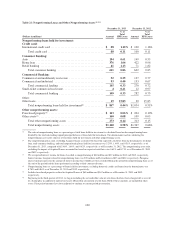
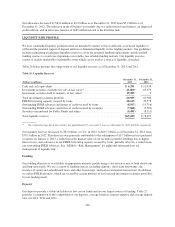
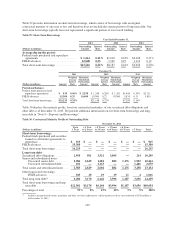
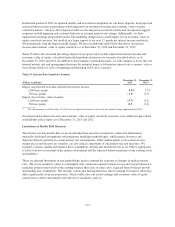
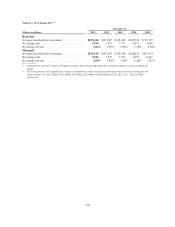
Table 28 presents the contractual maturities of large-denomination time deposits of $100,000 or more. Our
funding and liquidity management activities factor into the expected maturities of these deposits. Based on past
activity, we expect to retain a portion of these deposits as they mature. Accordingly, we expect the actual net
cash outflows will be less than the contractual maturity amounts.
Table 28: Maturities of Large Denomination Domestic Time Deposits—$100,000 or More
December 31,
2013(1) 2012
(Dollars in millions) Amount
% of
Total Amount
% of
Total
Up to three months ............................................. $1,698 42.1% $ 447 10.0%
> 3 months to 6 months . ........................................ 325 8.1 451 10.0
> 6 months to 12 months ........................................ 645 16.0 1,948 43.3
> 12 months to 10 years . ........................................ 1,365 33.8 1,649 36.7
Total ........................................................ $4,033 100.0% $4,495 100.0%
(1) In 2013 we began including foreign time deposits greater than $100,000 which were issued in domestic offices in our maturities
schedule of large denomination time deposits.
Other Funding Sources
We also access the capital markets to meet our funding needs through the use of the issuance of senior and
subordinated notes, loan securitization transactions, and federal funds purchased and securities loaned or sold
under agreements to repurchase. We participate in the federal funds market regularly to take advantage of
attractive offers and to keep a visible presence in the market, which is intended to ensure that we are able to
access the federal funds market in a time of need. In addition, we may utilize short-term as well as long-term
FHLB advances for our funding needs. FHLB advances are secured by our investment securities, residential
home loans, multifamily loans, commercial real-estate loans and home equity lines of credit.
Other debt, which consists of federal funds purchased and securities loaned or sold under agreements to
repurchase, senior and subordinated notes and other borrowings and FHLB advances, but excluding securitized
debt obligations, totaled $30.4 billion as of December 31, 2013, of which $16.2 billion represented short-term
borrowings and $14.2 billion represented long-term debt. Other debt decreased by $8.1 billion in 2013 from a
total $38.5 billion as of December 31, 2012, of which $21.1 billion represented short-term borrowings and
$17.4 billion represented long-term borrowings.
108