Capital One 2013 Annual Report Download - page 253
Download and view the complete annual report
Please find page 253 of the 2013 Capital One annual report below. You can navigate through the pages in the report by either clicking on the pages listed below, or by using the keyword search tool below to find specific information within the annual report.-
 1
1 -
2
-
3
-
4
-
5
-
6
-
7
-
8
-
9
-
10
-
11
-
12
-
13
-
14
-
15
-
16
-
17
-
18
-
19
-
20
-
21
-
22
-
23
-
24
-
25
-
26
-
27
-
28
-
29
-
30
-
31
-
32
-
33
-
34
-
35
-
36
-
37
-
38
-
39
-
40
-
41
-
42
-
43
-
44
-
45
-
46
-
47
-
48
-
49
-
50
-
51
-
52
-
53
-
54
-
55
-
56
-
57
-
58
-
59
-
60
-
61
-
62
-
63
-
64
-
65
-
66
-
67
-
68
-
69
-
70
-
71
-
72
-
73
-
74
-
75
-
76
-
77
-
78
-
79
-
80
-
81
-
82
-
83
-
84
-
85
-
86
-
87
-
88
-
89
-
90
-
91
-
92
-
93
-
94
-
95
-
96
-
97
-
98
-
99
-
100
-
101
-
102
-
103
-
104
-
105
-
106
-
107
-
108
-
109
-
110
-
111
-
112
-
113
-
114
-
115
-
116
-
117
-
118
-
119
-
120
-
121
-
122
-
123
-
124
-
125
-
126
-
127
-
128
-
129
-
130
-
131
-
132
-
133
-
134
-
135
-
136
-
137
-
138
-
139
-
140
-
141
-
142
-
143
-
144
-
145
-
146
-
147
-
148
-
149
-
150
-
151
-
152
-
153
-
154
-
155
-
156
-
157
-
158
-
159
-
160
-
161
-
162
-
163
-
164
-
165
-
166
-
167
-
168
-
169
-
170
-
171
-
172
-
173
-
174
-
175
-
176
-
177
-
178
-
179
-
180
-
181
-
182
-
183
-
184
-
185
-
186
-
187
-
188
-
189
-
190
-
191
-
192
-
193
-
194
-
195
-
196
-
197
-
198
-
199
-
200
-
201
-
202
-
203
-
204
-
205
-
206
-
207
-
208
-
209
-
210
-
211
-
212
-
213
-
214
-
215
-
216
-
217
-
218
-
219
-
220
-
221
-
222
-
223
-
224
-
225
-
226
-
227
-
228
-
229
-
230
-
231
-
232
-
233
-
234
-
235
-
236
-
237
-
238
-
239
-
240
-
241
-
242
-
 243
243 -
 244
244 -
 245
245 -
 246
246 -
 247
247 -
 248
248 -
 249
249 -
 250
250 -
 251
251 -
 252
252 -
 253
253 -
 254
254 -
 255
255 -
 256
256 -
 257
257 -
 258
258 -
 259
259 -
 260
260 -
 261
261 -
 262
262 -
 263
263 -
264
-
265
-
266
-
267
-
268
-
269
-
270
-
271
-
272
-
273
-
274
-
275
-
276
-
277
-
278
-
279
-
280
-
281
-
282
-
283
-
284
-
285
-
286
-
287
-
288
-
289
-
290
-
291
-
292
-
293
-
294
-
295
-
296
-
297
-
298
-
299
-
300
-
301
-
302
 |
 |

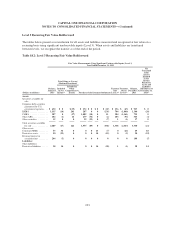
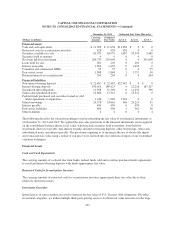
CAPITAL ONE FINANCIAL CORPORATION
NOTES TO CONSOLIDATED FINANCIAL STATEMENTS—(Continued)
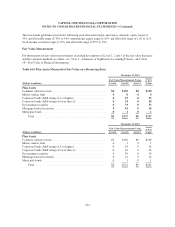
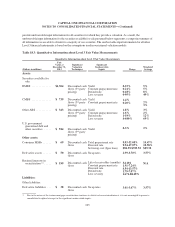
Level 3 Recurring Fair Value Rollforward
The tables below present a reconciliation for all assets and liabilities measured and recognized at fair value on a
recurring basis using significant unobservable inputs (Level 3). When assets and liabilities are transferred
between levels, we recognize the transfer as of the end of the period.
Table 18.2: Level 3 Recurring Fair Value Rollforward
Fair Value Measurements Using Significant Unobservable Inputs (Level 3)
Year Ended December 31, 2013
Total Gains or (Losses)
(Realized/Unrealized)
Net
Unrealized
Gains
(Losses)
Included
in Net
Income
Related to
Assets and
Liabilities
Still Held as of
December 31,
2013(3)
(Dollars in millions)
Balance,
January 1,
2013
Included
in Net
Income(1)
Included in
Other
Comprehensive
Income Purchases Sales Issuances Settlements
Transfers
Into
Level 3(2)
Transfers
Out of
Level 3(2)
Balance,
December 31,
2013
Assets:
Securities available for
sale:
Corporate debt securities
guaranteed by U.S.
government agencies . . . $ 650 $ 0 $ (39) $ 272 $ 0 $ 0 $ (67) $ 156 $ (45) $ 927 $ 0
RMBS ................ 1,335 (16) 203 287 0 0 (239) 794 (1,060) 1,304 (20)
CMBS ................ 587 0 (57) 1,085 (10) 0 11 284 (1,161) 739 0
Other ABS ............. 102 (1) 14 279 (56) 0 (2) 103 (96) 343 (1)
Other securities ......... 15 0 0 32 (23) 0 (7) 1 (1) 17 0
Total securities available
for sale .............. 2,689 (17) 121 1,955 (89) 0 (304) 1,338 (2,363) 3,330 (21)
Other assets:
Consumer MSRs ........ 55 34 0 0 0 13 (7) 0 (26) 69 18
Derivative assets . ....... 90 (22) 0 0 0 10 (19) 0 (9) 50 (22)
Retained interest in
securitizations ........ 204 (5) 0 0 0 0 0 0 0 199 (5)
Liabilities:
Other liabilities:
Derivative liabilities ..... 38 14 0 0 0 14 (28) 1 (1) 38 14
233