Capital One 2013 Annual Report Download - page 197
Download and view the complete annual report
Please find page 197 of the 2013 Capital One annual report below. You can navigate through the pages in the report by either clicking on the pages listed below, or by using the keyword search tool below to find specific information within the annual report.-
 1
1 -
2
-
3
-
4
-
5
-
6
-
7
-
8
-
9
-
10
-
11
-
12
-
13
-
14
-
15
-
16
-
17
-
18
-
19
-
20
-
21
-
22
-
23
-
24
-
25
-
26
-
27
-
28
-
29
-
30
-
31
-
32
-
33
-
34
-
35
-
36
-
37
-
38
-
39
-
40
-
41
-
42
-
43
-
44
-
45
-
46
-
47
-
48
-
49
-
50
-
51
-
52
-
53
-
54
-
55
-
56
-
57
-
58
-
59
-
60
-
61
-
62
-
63
-
64
-
65
-
66
-
67
-
68
-
69
-
70
-
71
-
72
-
73
-
74
-
75
-
76
-
77
-
78
-
79
-
80
-
81
-
82
-
83
-
84
-
85
-
86
-
87
-
88
-
89
-
90
-
91
-
92
-
93
-
94
-
95
-
96
-
97
-
98
-
99
-
100
-
101
-
102
-
103
-
104
-
105
-
106
-
107
-
108
-
109
-
110
-
111
-
112
-
113
-
114
-
115
-
116
-
117
-
118
-
119
-
120
-
121
-
122
-
123
-
124
-
125
-
126
-
127
-
128
-
129
-
130
-
131
-
132
-
133
-
134
-
135
-
136
-
137
-
138
-
139
-
140
-
141
-
142
-
143
-
144
-
145
-
146
-
147
-
148
-
149
-
150
-
151
-
152
-
153
-
154
-
155
-
156
-
157
-
158
-
159
-
160
-
161
-
162
-
163
-
164
-
165
-
166
-
167
-
168
-
169
-
170
-
171
-
172
-
173
-
174
-
175
-
176
-
177
-
178
-
179
-
180
-
181
-
182
-
183
-
184
-
185
-
186
-
 187
187 -
 188
188 -
 189
189 -
 190
190 -
 191
191 -
 192
192 -
 193
193 -
 194
194 -
 195
195 -
 196
196 -
 197
197 -
 198
198 -
 199
199 -
 200
200 -
 201
201 -
 202
202 -
 203
203 -
 204
204 -
 205
205 -
 206
206 -
 207
207 -
208
-
209
-
210
-
211
-
212
-
213
-
214
-
215
-
216
-
217
-
218
-
219
-
220
-
221
-
222
-
223
-
224
-
225
-
226
-
227
-
228
-
229
-
230
-
231
-
232
-
233
-
234
-
235
-
236
-
237
-
238
-
239
-
240
-
241
-
242
-
243
-
244
-
245
-
246
-
247
-
248
-
249
-
250
-
251
-
252
-
253
-
254
-
255
-
256
-
257
-
258
-
259
-
260
-
261
-
262
-
263
-
264
-
265
-
266
-
267
-
268
-
269
-
270
-
271
-
272
-
273
-
274
-
275
-
276
-
277
-
278
-
279
-
280
-
281
-
282
-
283
-
284
-
285
-
286
-
287
-
288
-
289
-
290
-
291
-
292
-
293
-
294
-
295
-
296
-
297
-
298
-
299
-
300
-
301
-
302
 |
 |

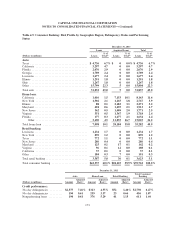
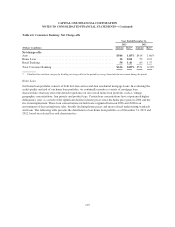
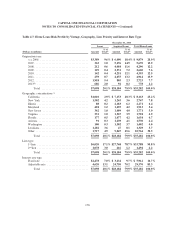
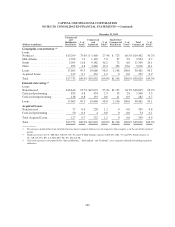
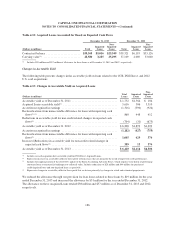
CAPITAL ONE FINANCIAL CORPORATION
NOTES TO CONSOLIDATED FINANCIAL STATEMENTS—(Continued)
December 31, 2012
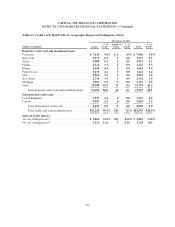
Loans Acquired Loans Total Home Loans
(Dollars in millions) Amount
% of
Total(1) Amount
% of
Total(1) Amount
% of
Total(1)
Origination year:
< = 2006 .................................. $4,104 9.3% $ 7,723 17.5% $11,827 26.8%
2007 ...................................... 446 1.0 6,189 14.0 6,635 15.0
2008 ...................................... 257 0.6 5,210 11.8 5,467 12.4
2009 ...................................... 167 0.4 3,438 7.8 3,605 8.2
2010 ...................................... 188 0.4 6,024 13.7 6,212 14.1
2011 ...................................... 324 0.7 6,705 15.2 7,029 15.9
2012 ...................................... 2,211 5.1 1,114 2.5 3,325 7.6
Total ................................. $7,697 17.5% $36,403 82.5% $44,100 100.0%
Geographic concentration:(2)
California ................................. $1,168 2.7% $ 9,098 20.6% $10,266 23.3%
New York ................................. 1,678 3.8 1,598 3.6 3,276 7.4
Illinois .................................... 102 0.2 2,875 6.5 2,977 6.7
Maryland .................................. 403 0.9 1,878 4.3 2,281 5.2
New Jersey ................................ 402 0.9 1,717 3.9 2,119 4.8
Virginia ................................... 342 0.8 1,748 4.0 2,090 4.8
Florida .................................... 183 0.4 1,863 4.2 2,046 4.6
Arizona ................................... 95 0.2 1,828 4.1 1,923 4.3
Washington ................................ 113 0.3 1,766 4.0 1,879 4.3
Colorado .................................. 126 0.3 1,594 3.6 1,720 3.9
Other ..................................... 3,085 7.0 10,438 23.7 13,523 30.7
Total ................................. $7,697 17.5% $36,403 82.5% $44,100 100.0%
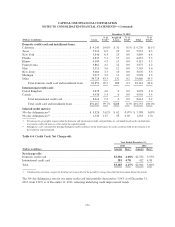
Lien type:
1st lien .................................... $6,502 14.8% $35,905 81.4% $42,407 96.2%
2nd lien .................................... 1,195 2.7 498 1.1 1,693 3.8
Total ................................. $7,697 17.5% $36,403 82.5% $44,100 100.0%
Interest rate type:
Fixed rate ................................. $2,534 5.8% $ 4,037 9.1% $ 6,571 14.9%
Adjustable rate ............................. 5,163 11.7 32,366 73.4 37,529 85.1
Total ................................. $7,697 17.5% $36,403 82.5% $44,100 100.0%
(1) Percentages within each risk category are calculated based on total home loans held for investment.
(2) Represents the ten states in which we have the highest concentration of home loans.
(3) The Acquired Loans origination balance in 2013 is related to refinancing of previously acquired home loans.
177