Capital One 2013 Annual Report Download - page 115
Download and view the complete annual report
Please find page 115 of the 2013 Capital One annual report below. You can navigate through the pages in the report by either clicking on the pages listed below, or by using the keyword search tool below to find specific information within the annual report.-
 1
1 -
2
-
3
-
4
-
5
-
6
-
7
-
8
-
9
-
10
-
11
-
12
-
13
-
14
-
15
-
16
-
17
-
18
-
19
-
20
-
21
-
22
-
23
-
24
-
25
-
26
-
27
-
28
-
29
-
30
-
31
-
32
-
33
-
34
-
35
-
36
-
37
-
38
-
39
-
40
-
41
-
42
-
43
-
44
-
45
-
46
-
47
-
48
-
49
-
50
-
51
-
52
-
53
-
54
-
55
-
56
-
57
-
58
-
59
-
60
-
61
-
62
-
63
-
64
-
65
-
66
-
67
-
68
-
69
-
70
-
71
-
72
-
73
-
74
-
75
-
76
-
77
-
78
-
79
-
80
-
81
-
82
-
83
-
84
-
85
-
86
-
87
-
88
-
89
-
90
-
91
-
92
-
93
-
94
-
95
-
96
-
97
-
98
-
99
-
100
-
101
-
102
-
103
-
104
-
 105
105 -
 106
106 -
 107
107 -
 108
108 -
 109
109 -
 110
110 -
 111
111 -
 112
112 -
 113
113 -
 114
114 -
 115
115 -
 116
116 -
 117
117 -
 118
118 -
 119
119 -
 120
120 -
 121
121 -
 122
122 -
 123
123 -
 124
124 -
 125
125 -
126
-
127
-
128
-
129
-
130
-
131
-
132
-
133
-
134
-
135
-
136
-
137
-
138
-
139
-
140
-
141
-
142
-
143
-
144
-
145
-
146
-
147
-
148
-
149
-
150
-
151
-
152
-
153
-
154
-
155
-
156
-
157
-
158
-
159
-
160
-
161
-
162
-
163
-
164
-
165
-
166
-
167
-
168
-
169
-
170
-
171
-
172
-
173
-
174
-
175
-
176
-
177
-
178
-
179
-
180
-
181
-
182
-
183
-
184
-
185
-
186
-
187
-
188
-
189
-
190
-
191
-
192
-
193
-
194
-
195
-
196
-
197
-
198
-
199
-
200
-
201
-
202
-
203
-
204
-
205
-
206
-
207
-
208
-
209
-
210
-
211
-
212
-
213
-
214
-
215
-
216
-
217
-
218
-
219
-
220
-
221
-
222
-
223
-
224
-
225
-
226
-
227
-
228
-
229
-
230
-
231
-
232
-
233
-
234
-
235
-
236
-
237
-
238
-
239
-
240
-
241
-
242
-
243
-
244
-
245
-
246
-
247
-
248
-
249
-
250
-
251
-
252
-
253
-
254
-
255
-
256
-
257
-
258
-
259
-
260
-
261
-
262
-
263
-
264
-
265
-
266
-
267
-
268
-
269
-
270
-
271
-
272
-
273
-
274
-
275
-
276
-
277
-
278
-
279
-
280
-
281
-
282
-
283
-
284
-
285
-
286
-
287
-
288
-
289
-
290
-
291
-
292
-
293
-
294
-
295
-
296
-
297
-
298
-
299
-
300
-
301
-
302
 |
 |

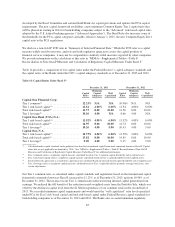
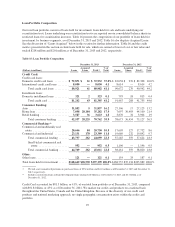
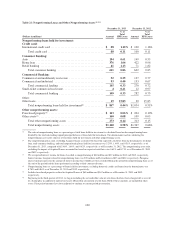
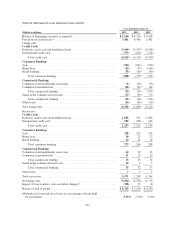
Loan Portfolio Composition
Our total loan portfolio consists of loans held for investment, loans held for sale and loans underlying our
securitization trust. Loans underlying our securitization trusts are reported on our consolidated balance sheets in
restricted loans for securitization investors. Table 16 presents the composition of our portfolio of loans held for
investment, by business segments, as of December 31, 2013 and 2012. Table 16 also displays Acquired Loans.
See the discussion of “Loans Acquired” below in this section for further information. Table 16 and the credit
metrics presented in this section exclude loans held for sale, which are carried at lower of cost or fair value and
totaled $218 million and $201 million as of December 31, 2013 and 2012, respectively.
Table 16: Loan Portfolio Composition
December 31, 2013 December 31, 2012
(Dollars in millions) Loans
Acquired
Loans Total(1)
% of
Total Loans
Acquired
Loans Total(1)
% of
Total
Credit Card:
Credit card loans:
Domestic credit card loans ..........$ 72,871 $ 61 $ 72,932 37.0%$ 82,058 $ 270 $ 82,328 40.0%
International credit card loans ........ 8,050 — 8,050 4.1 8,614 — 8,614 4.2
Total credit card loans .......... 80,921 61 80,982 41.1 90,672 270 90,942 44.2
Installment loans:
Domestic installment loans .......... 321 2 323 0.1 795 18 813 0.4
Total credit card ............... 81,242 63 81,305 41.2 91,467 288 91,755 44.6
Consumer Banking:
Auto ............................ 31,852 5 31,857 16.2 27,106 17 27,123 13.2
Home loan ....................... 7,098 28,184 35,282 17.9 7,697 36,403 44,100 21.4
Retail banking .................... 3,587 36 3,623 1.8 3,870 34 3,904 1.9
Total consumer banking ........ 42,537 28,225 70,762 35.9 38,673 36,454 75,127 36.5
Commercial Banking:(2)
Commercial and multifamily real
estate ......................... 20,666 84 20,750 10.5 17,605 127 17,732 8.6
Commercial and industrial .......... 23,131 178 23,309 11.8 19,660 232 19,892 9.7
Total commercial lending ....... 43,797 262 44,059 22.3 37,265 359 37,624 18.3
Small-ticket commercial real
estate ..................... 952 — 952 0.5 1,196 — 1,196 0.5
Total commercial banking ....... 44,749 262 45,011 22.8 38,461 359 38,820 18.8
Other:
Other loans ....................... 121 — 121 0.1 154 33 187 0.1
Total loans held for investment .......$168,649 $28,550 $197,199 100.0%$168,755 $37,134 $205,889 100.0%
(1) We had a net unamortized premium on purchased loans of $234 million and $461 million as of December 31, 2013 and December 31,
2012, respectively.
(2) Includes construction loans and land development loans totaling $2.0 billion as of December 31, 2013 and $2.1 billion as of
December 31, 2012.
Credit Card accounted for $81.3 billion, or 41%, of our total loan portfolio as of December 31, 2013, compared
with $91.8 billion, or 45% as of December 31, 2012. We market our credit card products on a national basis
throughout the United States, Canada and the United Kingdom. Because of the diversity of our credit card
products and national marketing approach, no single geographic concentration exists within the credit card
portfolio.
95